DAL Earnings Preview: Analyzing Potential Stock Movement

Delta Air Lines (NYSE:DAL) is scheduled to release its earnings report on Thursday, July 10, 2025. Historical data suggests a cautious outlook for the stock’s immediate post-earnings performance. Over the past five years, Delta’s stock has experienced a negative one-day return following earnings announcements in 70% of instances. The median one-day decline during these periods was -2.7%, with the most significant single-day drop reaching -9%.
For the latest quarter, analysts anticipate Delta will report earnings of $2.03 per share on sales of $16.18 billion for the upcoming quarter. This marks a decrease compared to the same quarter last year, when the company posted earnings of $2.36 per share on sales of $16.66 billion.
A decline in consumer sentiment, likely driven by ongoing geopolitical tensions, economic uncertainty, and trade conflicts, appears to have contributed to a softening in air travel demand. This broader market sentiment may explain why DAL stock has seen a significant 14% drop year-to-date, in stark contrast to the S&P 500 index’s 7% rise over the same period.
While the company’s performance against consensus estimates will be crucial, understanding historical patterns can be advantageous for event-driven traders. There are two primary strategies:
- Pre-Earnings Positioning: Analyze historical odds and adjust your position before the earnings release.
- Post-Earnings Positioning: Examine the correlation between immediate and medium-term returns following earnings announcements to inform your trading decisions after the report is public.
Looking at fundamentals, over the last twelve months, Delta reported revenues of $62 billion. The company demonstrated operational profitability, generating $6.0 billion in operating profits and a net income of $3.7 billion during this period. Now, if you seek upside with lower volatility than individual stocks, the Trefis High Quality portfolio presents an alternative — having outperformed the S&P 500 and generated returns exceeding 91% since its inception.
See earnings reaction history of all stocks

Image by Cor Gaasbeek from Pixabay
Delta Air Lines’ Historical Odds Of Positive Post-Earnings Return
Delta Air Lines’ Historical Odds Of Positive Post-Earnings Return
Some observations on one-day (1D) post-earnings returns:
- There are 20 earnings data points recorded over the last five years, with 6 positive and 14 negative one-day (1D) returns observed. In summary, positive 1D returns were seen about 30% of the time.
- However, this percentage decreases to 25% if we consider data for the last 3 years instead of 5.
- Median of the 6 positive returns = 5.1%, and median of the 14 negative returns = -2.7%
Additional data for observed 5-Day (5D), and 21-Day (21D) returns post earnings are summarized along with the statistics in the table below.
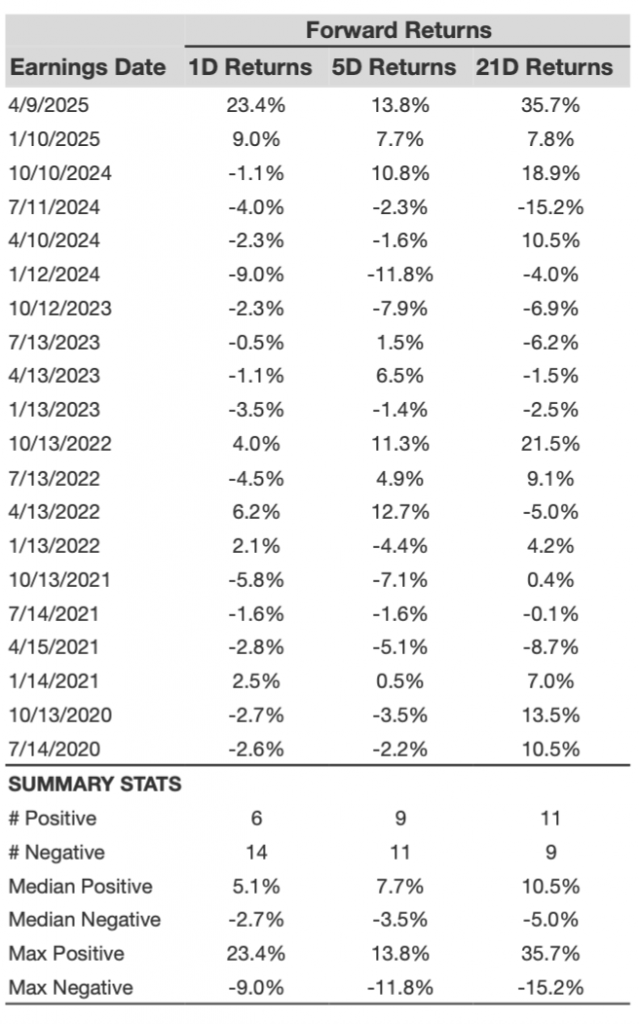
DAL 1D, 5D, and 21D Post Earnings Return
Correlation Between 1D, 5D, and 21D Historical Returns
A relatively less risky strategy (though not useful if the correlation is low) is to understand the correlation between short-term and medium-term returns post earnings, find a pair that has the highest correlation, and execute the appropriate trade. For example, if 1D and 5D show the highest correlation, a trader can position themselves “long” for the next 5 days if 1D post-earnings return is positive. Here is some correlation data based on 5-year and 3-year (more recent) history. Note that the correlation 1D_5D refers to the correlation between 1D post-earnings returns and subsequent 5D returns.
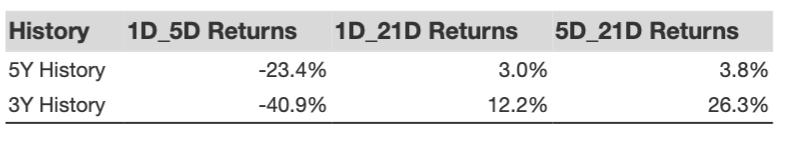
DAL Correlation Between 1D, 5D, and 21D Historical Returns
Learn more about Trefis RV strategy that has outperformed its all-cap stocks benchmark (combination of all 3, the S&P 500, S&P mid-cap, and Russell 2000), to produce strong returns for investors. Separately, if you want upside with a smoother ride than an individual stock like Delta Air Lines, consider the High Quality portfolio, which has outperformed the S&P, and clocked >91% returns since inception.
Invest with Trefis Market-Beating Portfolios
See all Trefis Price Estimates