Buy or Sell Delta Air Lines Stock Ahead of Its Upcoming Earnings?

Delta Air Lines (NYSE: DAL) is scheduled to report its earnings on Thursday, October 9, 2025.
For event-driven traders, understanding the stock’s historical reaction to earnings can provide a critical edge, regardless of how the actual results align with consensus estimates. Traders typically use historical patterns in two ways:
- Pre-Earnings: Position themselves based on the historical probability of movement prior to the earnings release.
- Post-Earnings: Analyze the correlation between immediate and medium-term returns after the release and position themselves accordingly.
Historically, DAL stock has shown a notable negative bias following earnings announcements. Over the last five years, the stock has posted a negative one-day return in 65% of instances. The median one-day decline has been −2.7%, with a maximum one-day drop of −9.0%.
Consensus estimates project earnings of $1.52 per share on sales of $15.94 billion. This compares to the year-ago quarter’s earnings of $1.50 per share on sales of $15.68 billion.
- Better Value & Growth: LTM Leads Delta Air Lines Stock
- Delta Air Lines Earnings Driven By Premium Revenue And Cost Discipline
- Delta Premium Gains Squeezed by Fuel Shock
- LTM Looks Smarter Buy Than Delta Air Lines Stock
- Stronger Bet Than Delta Air Lines Stock: LTM Delivers More
- Down 21%, Is Delta Air Lines Stock a Buy Now?
Fundamentally, Delta Air Lines has a current market capitalization of $37 billion. The company reported $62 billion in revenue over the last twelve months, achieving strong operational profitability with $5.8 billion in operating profit and $4.5 billion in net income.
That being said, if you seek an upside with less volatility than holding an individual stock like DAL, consider the High Quality Portfolio. It has comfortably outperformed its benchmark—a combination of the S&P 500, Russell, and S&P MidCap indexes—and has achieved returns exceeding 91% since its inception. Why is that? As a group, HQ Portfolio stocks provided better returns with less risk versus the benchmark index; less of a roller-coaster ride, as evident in HQ Portfolio performance metrics.
See earnings reaction history of all stocks

Image by Cor Gaasbeek from Pixabay
Delta Air Lines’ Historical Odds Of Positive Post-Earnings Return
Some observations on one-day (1D) post-earnings returns:
- There are 20 earnings data points recorded over the last five years, with 7 positive and 13 negative one-day (1D) returns observed. In summary, positive 1D returns were seen about 35% of the time.
- However, this percentage decreases to 33% if we consider data for the last 3 years instead of 5.
- Median of the 7 positive returns = 6.2%, and median of the 13 negative returns = -2.7%
Additional data for observed 5-Day (5D) and 21-Day (21D) returns post earnings are summarized along with the statistics in the table below.
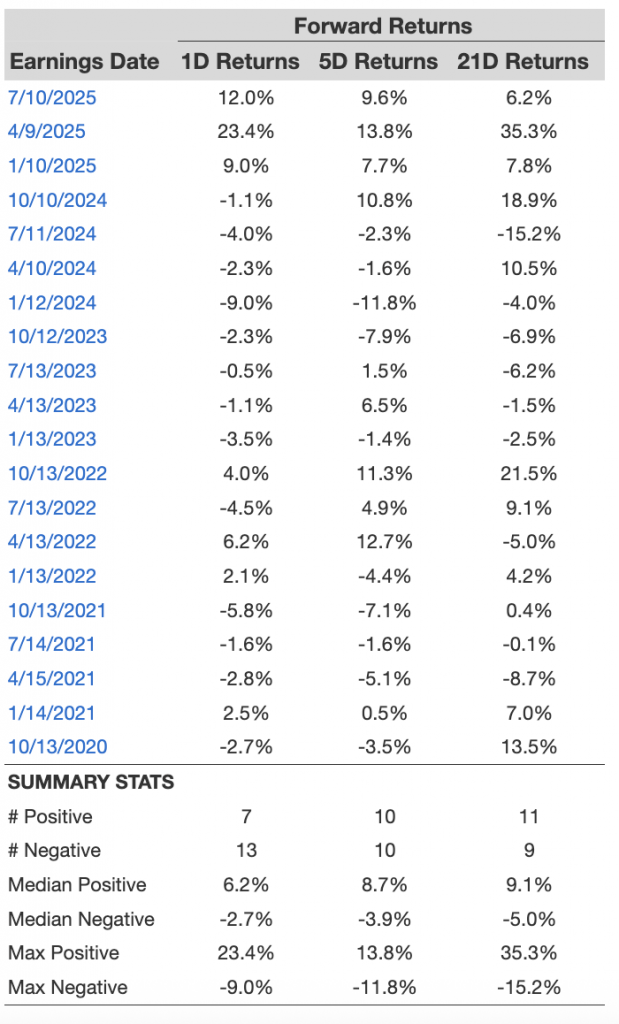
DAL 1D, 5D, and 21D Post Earnings Returns
Correlation Between 1D, 5D, and 21D Historical Returns
A relatively less risky strategy (though not useful if the correlation is low) is to understand the correlation between short-term and medium-term returns post earnings, find a pair that has the highest correlation, and execute the appropriate trade. For example, if 1D and 5D show the highest correlation, a trader can position themselves “long” for the next 5 days if the 1D post-earnings return is positive. Here is some correlation data based on a 5-year and a 3-year (more recent) history. Note that the correlation 1D_5D refers to the correlation between 1D post-earnings returns and subsequent 5D returns.
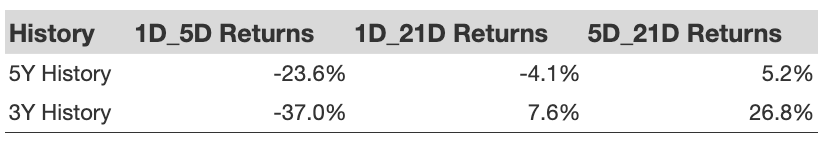
DAL Correlation Between 1D, 5D, and 21D Historical Returns
Investing in a single stock without comprehensive analysis can be risky. Consider the Trefis Reinforced Value (RV) Portfolio, which has outperformed its all-cap stocks benchmark (combination of the S&P 500, S&P mid-cap, and Russell 2000 benchmark indices) to produce strong returns for investors. Why is that? The quarterly rebalanced mix of large-, mid-, and small-cap RV Portfolio stocks provided a responsive way to make the most of upbeat market conditions while limiting losses when markets head south, as detailed in RV Portfolio performance metrics.
Invest with Trefis Market-Beating Portfolios
See all Trefis Price Estimates