How Will Cleveland-Cliifs Stock React To Its Upcoming Earnings?
Cleveland-Cliffs (NYSE:CLF) is set to report its earnings on Monday, July 21, 2025. Consensus earnings are pegged at about $0.63 per share, reflecting continued margin pressure despite recent cost-saving initiatives, while revenues are expected to drop by close to 4% compared to the year ago quarter. Q2 should start showing early benefits from cost cuts and better pricing, while the new anneal line begins contributing revenue. Still, the company is likely to remain in loss territory until full H2 savings are booked and automotive demand strengthens further.
The company has $4.8 Bil in current market capitalization. Revenue over the last twelve months was $19 Bil, and it was operationally loss-making with $-1.2 Bil in operating losses and net income of $-1.2 Bil. That said, if you seek upside with lower volatility than individual stocks, the Trefis High Quality portfolio presents an alternative – having outperformed the S&P 500 and generated returns exceeding 91% since its inception.
See earnings reaction history of all stocks
Cleveland-Cliffs’s Historical Odds Of Positive Post-Earnings Return
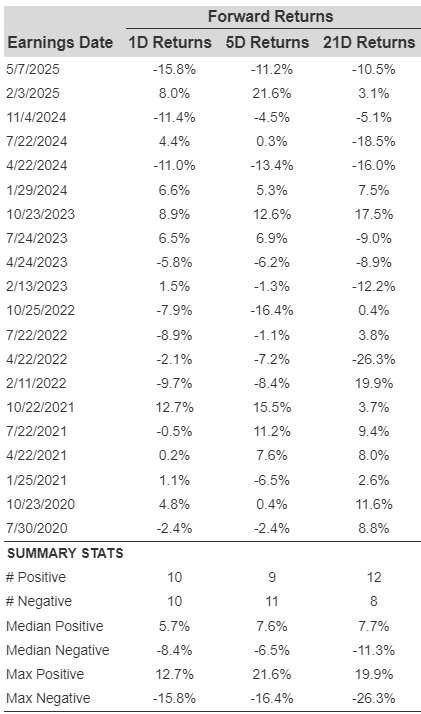
Some observations on one-day (1D) post-earnings returns:
- There are 20 earnings data points recorded over the last five years, with 10 positive and 10 negative one-day (1D) returns observed. In summary, positive 1D returns were seen about 50% of the time.
- The percentage remains the same at 50% if we consider data for the last 3 years instead of 5.
- Median of the 10 positive returns = 5.7%, and median of the 10 negative returns = -8.4%
Additional data for observed 5-Day (5D), and 21-Day (21D) returns post earnings are summarized along with the statistics in the table below.
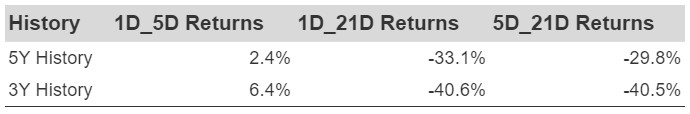
Correlation Between 1D, 5D, and 21D Historical Returns
A relatively less risky strategy (though not useful if the correlation is low) is to understand the correlation between short-term and medium-term returns post earnings, find a pair that has the highest correlation, and execute the appropriate trade. For example, if 1D and 5D show the highest correlation, a trader can position themselves “long” for the next 5 days if 1D post-earnings return is positive. Here is some correlation data based on 5-year and 3-year (more recent) history. Note that the correlation 1D_5D refers to the correlation between 1D post-earnings returns and subsequent 5D returns.
Learn more about Trefis RV strategy that has outperformed its all-cap stocks benchmark (combination of all 3, the S&P 500, S&P mid-cap, and Russell 2000), to produce strong returns for investors. Separately, if you want upside with a smoother ride than an individual stock like Cleveland-Cliffs, consider the High Quality portfolio, which has outperformed the S&P, and clocked >91% returns since inception.
See all Trefis Price Estimates