How Will Cleveland-Cliffs Stock React To Its Upcoming Earnings?

Cleveland-Cliffs (NYSE:CLF) is set to report its earnings on May 7, 2025. Revenues are likely to come in at $5.2 billion, as per our estimates, while consensus estimates for earnings are projected at a loss of $0.83 per share. This negative earnings is primarily due to declining steel prices and softer demand in key sectors like automotive and construction. The company faces headwinds from falling U.S. hot-rolled coil (HRC) prices, which have dropped to around $665 per ton. This decline, coupled with rising inventory levels and shorter lead times, suggests a weakening market environment that could impact Cleveland-Cliffs’ revenue and profitability.
The company has $4.0 Bil in current market capitalization. Revenue over the last twelve months was $19 Bil, and it was operationally loss-making with $-504 Mil in operating losses and net income of $-754 Mil. That said, if you seek upside with lower volatility than individual stocks, the Trefis High Quality portfolio presents an alternative – having outperformed the S&P 500 and generated returns exceeding 91% since its inception.
See earnings reaction history of all stocks
Cleveland-Cliffs’ Historical Odds Of Positive Post-Earnings Return
- What’s Next for Cleveland-Cliffs Stock?
- Cleveland-Cliffs Stock: Can 2026 Mark a Turnaround Year?
- With Cleveland-Cliffs Stock Sliding, Have You Assessed The Risk?
- Why Has Cleveland-Cliffs Stock Dropped 25%?
- How Will Cleveland-Cliffs Stock React To Its Upcoming Earnings?
- Buy Or Fear Cleveland-Cliffs Stock?
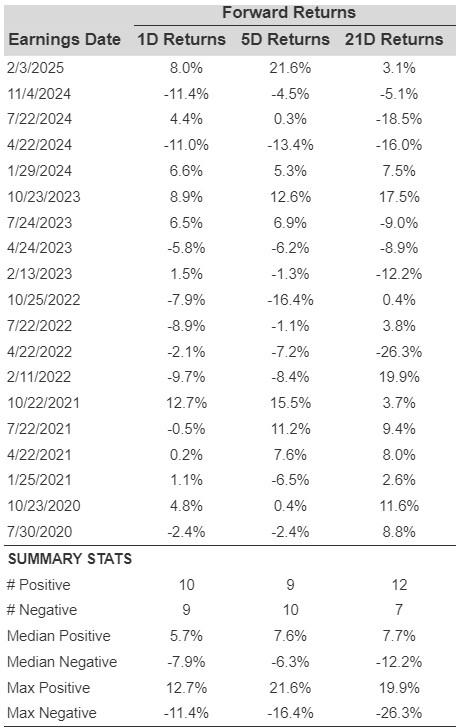
Some observations on one-day (1D) post-earnings returns:
- There are 19 earnings data points recorded over the last five years, with 10 positive and 9 negative one-day (1D) returns observed. In summary, positive 1D returns were seen about 53% of the time.
- Notably, this percentage increases to 55% if we consider data for the last 3 years instead of 5.
- Median of the 10 positive returns = 5.7%, and median of the 9 negative returns = -7.9%
Additional data for observed 5-Day (5D), and 21-Day (21D) returns post earnings are summarized along with the statistics in the table below.
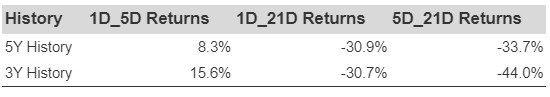
Correlation Between 1D, 5D, and 21D Historical Returns
A relatively less risky strategy (though not useful if the correlation is low) is to understand the correlation between short-term and medium-term returns post earnings, find a pair that has the highest correlation, and execute the appropriate trade. For example, if 1D and 5D show the highest correlation, a trader can position themselves “long” for the next 5 days if 1D post-earnings return is positive. Here is some correlation data based on 5-year and 3-year (more recent) history. Note that the correlation 1D_5D refers to the correlation between 1D post-earnings returns and subsequent 5D returns.
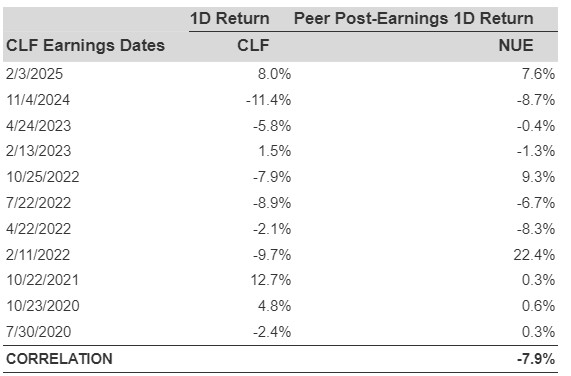
Is There Any Correlation With Peer Earnings?
Sometimes, peer performance can have influence on post-earnings stock reaction. In fact, the pricing-in might begin before the earnings are announced. Here is some historical data on the past post-earnings performance of Cleveland-Cliffs stock compared with the stock performance of peers that reported earnings just before Cleveland-Cliffs. For fair comparison, peer stock returns also represent post-earnings one-day (1D) returns.
Learn more about Trefis RV strategy that has outperformed its all-cap stocks benchmark (combination of all 3, the S&P 500, S&P mid-cap, and Russell 2000), to produce strong returns for investors. Separately, if you want upside with a smoother ride than an individual stock like Cleveland-Cliffs, consider the High Quality portfolio, which has outperformed the S&P, and clocked >91% returns since inception.