What Are The Factors Behind Soaring Air Travel Growth?

Air travel worldwide is likely to double over the next two decades, driven by factors such as low air fares, higher living standards, and an expected recovery in the world gross domestic production (GDP). However, this growth in enplaned passengers is expected to be uneven, given the changing population and demographic scenarios in different parts (developed and developing economies) of the world.
Uneven Growth
While most of the growth in air traffic is estimated to come from the emerging economies of India, China, and Brazil (5% to 7%), the U.S. will remain the second highest contributor to incremental air traffic in absolute numbers.
- Should You Pick American Airlines Stock At $14 After A 6% Fall In A Week?
- With 20% Gains This Month Is Alaska Air A Better Pick Than American Airlines Stock?
- Which Airlines Stock Will Offer Better Returns – American Or United?
- What To Expect From American Airlines’ Q2?
- Will American Airlines Stock Recover To Its Pre-Inflation-Shock Level?
- Pick Either American Airlines Stock Or Its Peer – Both May Offer Similar Returns
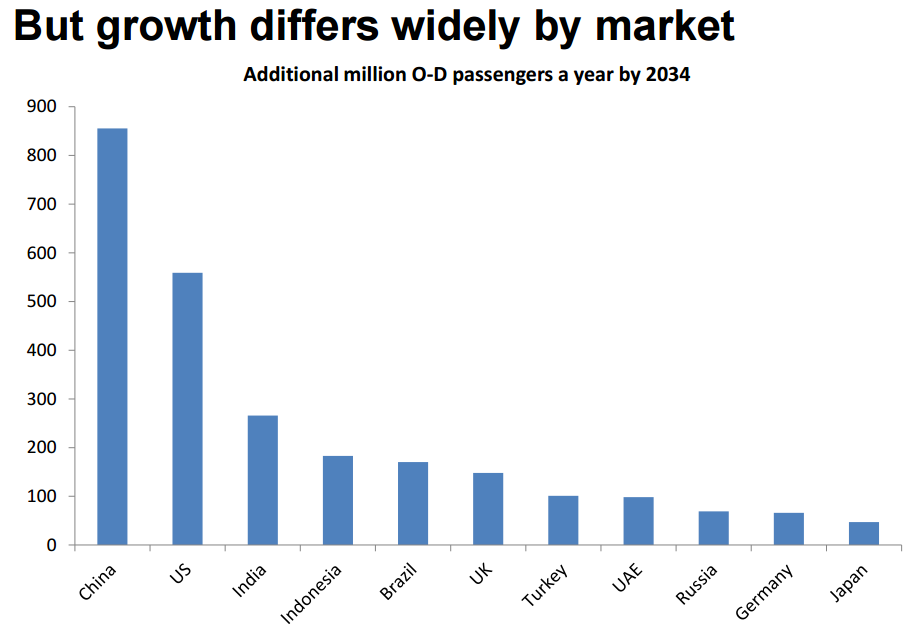
*O-D passengers refers to origin-destination passengers (doesn’t include stop-overs or connecting destinations)
Further, U.S. air traffic growth, at an estimated 3%, is the highest as compared to its peers among the developed nations. The growth in the U.S. air traffic is primarily supported by cheap air tickets and higher living standards due to the expected recovery of the U.S. economy going forward. Within the U.S. as well, the growth would be extremely disproportionate, coming from the high-income class more than low or middle income. While at the lower end, a person will make one trip per person in 25 years (low income group), at the upper end the number of trips made by a person in a year will be more than 1 (high income group).

Drivers of Air Traffic:
1.Higher living standards
Rising GDP, and consequently, disposable income and living standards, result in an increased demand for air travel for both business and leisure purposes. Although living standards is one of the most important determinants of the number of enplaned passengers, it is important only until a point. As can be seen in the graph below, despite highest GDP per capita, countries like Switzerland and Norway compare to those like Hong Kong and Singapore, in terms of flights per capita.

Source: International Air Transport Association (IATA)
More than developed economies, higher living standards propel the growth in air traffic for emerging economies as their propensity to spend can grow at a much higher pace, and their markets haven’t reached maturity yet. Research by International Air Transport Association (IATA) also says that countries on a growth curve up to approximately US$20,000 per capita witness correspondingly faster increases in the number of flights taken per person per year.
This is also closely linked to globalization, where the average distance traveled tends to increase as people take long-haul holidays and do business in countries which now have more favorable political and social environments.
You can refer to our article, Upside Scenario: Air Traffic Under Liberal Economic Policies, to study the effect of the change in living standards on an airline’s air traffic (revenue passenger miles). Further, please use our interactive charts below to study the impact of various drivers, like revenue passenger miles, on our price estimate for the company.
2.Demographics
Recent studies by International Air Transport Association (IATA) have concluded that working age population makes more trips than its older and younger counterparts. As a result, countries witnessing a shift in demographic trends in favor of working-age population are likely to see higher growth in their air traffic.

Source: International Air Transport Association (IATA)
3.Cost of Travel
Cost of travel is essentially the price paid by the customer to buy an air ticket. As air travel becomes cheaper, a larger number of people are able to afford it, resulting in an increase in traffic. In the last few years, the unit cost per trip has been on a downtrend, due to improvements in airline efficiency and increased competition. This development has been further supported by the fall in crude oil prices in 2014, cutting airfares by around 40% in real (i.e. inflation-adjusted) terms since the mid-1970s. However, there is a huge scope for these costs to come down further, given the fleet replacement program many airlines have undertaken to become more cost efficient, and the continued slump in oil prices.

Source: International Air Transport Association (IATA)
Greater liberalization of air markets has the potential to increase global air traffic growth by over 1% per year. However, in case of hostile situations (terror attacks) resulting in closed boundaries, we may see a downside in air traffic growth of only 1.6%, as opposed to the base case of 4% growth.
Please refer to our interactive charts below to study the impact of various drivers, like fuel costs, on our price estimate for the company.
Have more questions about American Airlines (NYSE:AAL)? See the following links:
- Lower Unit Revenues, Higher Tax Provisions Weigh On American Airlines’ Q2’16 Results
- American Q2’16 Earnings Preview: Rising Oil Prices, Lower Unit Revenues To Weigh Heavily
- Here Are The Key Factors That Can Impact American Airlines’ Earnings Growth
- Here’s Why We Revised American Airlines’ Price Estimate To $46 Per Share
- American Airlines’ 1Q’16 Revenue And Earnings Decline; Investors Penalize Airline For Downward Revision Of 2016 Capacity Growth Target
- US Legacy Carriers: A Comparison Of Aircraft Fleet
- How Important Will American’s International Operations Be In 2020?
- How Will American Airlines’ Equity Value Move, If Crude Oil Prices Rebound To $100 Per Barrel By 2018?
- Why Are American Airlines’ Domestic Operations More Valuable Than Its International Operations?
- How Will American Airlines’ Equity Value Move, If Crude Oil Prices Average $50 Per Barrel In 2018?
- How Did American Airlines’ Revenue And EBITDA Grow Over The Last Five Years?
- How Did American Airlines Use Its Increased Cash Flows In 2015?
- How Will American Airlines’ Revenue And EBITDA Grow Over The Next Five Years?
- What Is American Airlines’ Fundamental Value Based On 2016 Estimated Numbers?
- How Has The Oil Slump Impacted American Airlines’ Operating Margins?
- How Has American Airlines’ Revenue And EBITDA Composition Changes Over The Last Five Years?
- What Is American Airlines’ Revenue And EBITDA Breakdown?
- US Airlines: A Comparison Of Operating Margins
- US Airlines: A Comparison Of Dividend Yields
Notes:
1) The purpose of these analyses is to help readers focus on a few important things. We hope such lean communication sparks thinking, and encourages readers to comment and ask questions on the comment section, or email content@trefis.com
2) Figures mentioned are approximate values to help our readers remember the key concepts more intuitively. For precise figures, please refer to our complete analysis for American Airlines
View Interactive Institutional Research (Powered by Trefis):
Global Large Cap | U.S. Mid & Small Cap | European Large & Mid Cap