Will Q4 Results Move J.M. Smucker Stock Up?

J.M. Smucker Company (NYSE: SJM), sells food and beverage products, and is scheduled to release its fiscal fourth-quarter earnings on Tuesday, June 10, 2025, with analysts projecting earnings of $2.25 per share on $2.19 billion in revenue. This would represent a 2% year-over-year decline in earnings and a 1% fall in sales compared to the prior year’s figures of $2.30 per share and $2.21 billion in revenue. Historically, SJM stock has increased 63% of the time following earnings announcements, with a median one-day rise of 3.3% and a maximum observed increase of 7%.
J.M. Smucker’s success relies on smart acquisitions, cost discipline, and managing supply chain and commodity risks. As it shifts toward higher-growth segments, the focus remains on strengthening core brands like Folgers, Jif, and Milk-Bone while fending off private-label competition through differentiation and loyalty. The company has $12 Bil in current market capitalization. Revenue over the last twelve months was $8.8 Bil, and it was operationally profitable with $1.7 Bil in operating profits and net income of $-257 Mil.
For event-driven traders, historical patterns may offer an edge, whether by positioning ahead of earnings or reacting to post-release moves. That said, if you seek upside with lower volatility than from individual stocks, the Trefis High Quality portfolio presents an alternative, having outperformed the S&P 500 and generated returns exceeding 91% since its inception. See earnings reaction history of all stocks.

Photo by juttazeisset on Pixabay
- The Next Big Rally in Ford Motor Stock Could Start Like This
- The Risk Factors to Watch Out For in NVIDIA Stock
- Intuitive Surgical Stock Now 16% Cheaper, Time To Buy
- AT&T Stock Pays Out $85 Bil – Investors Take Note
- Intel Stock Pays Out $92 Bil – Investors Take Note
- Comcast Stock Capital Return Hits $44 Bil
SJM’s General Stores Historical Odds Of Positive Post-Earnings Return
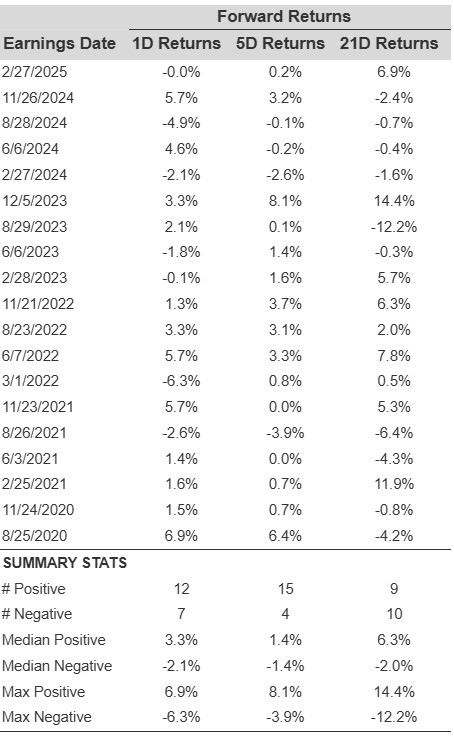
Some observations on one-day (1D) post-earnings returns:
- There are 19 earnings data points recorded over the last five years, with 12 positive and 7 negative one-day (1D) returns observed. In summary, positive 1D returns were seen about 63% of the time.
- However, this percentage decreases to 58% if we consider data for the last 3 years instead of 5.
- Median of the 12 positive returns = 3.3%, and median of the 7 negative returns = -2.1%
Additional data for observed 5-Day (5D), and 21-Day (21D) returns post earnings are summarized along with the statistics in the table below.
Correlation Between 1D, 5D, and 21D Historical Returns
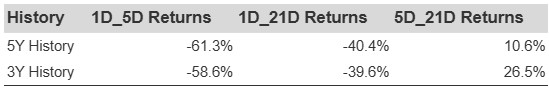
A relatively less risky strategy (though not useful if the correlation is low) is to understand the correlation between short-term and medium-term returns post earnings, find a pair that has the highest correlation, and execute the appropriate trade. For example, if 1D and 5D show the highest correlation, a trader can position themselves “long” for the next 5 days if 1D post-earnings return is positive. Here is some correlation data based on 5-year and 3-year (more recent) history. Note that the correlation 1D_5D refers to the correlation between 1D post-earnings returns and subsequent 5D returns.
SJM Correlation Between 1D, 5D and 21D Historical Returns
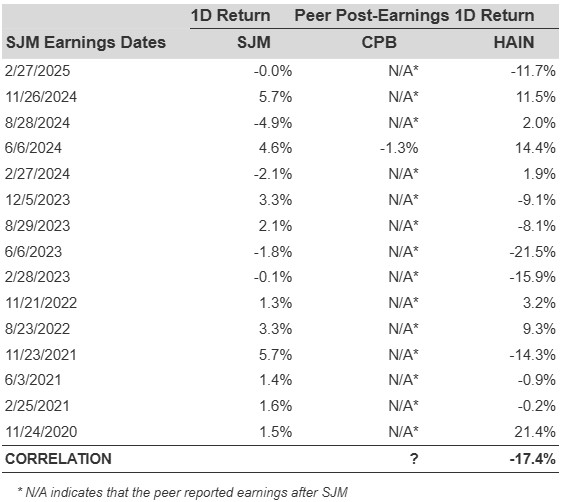
Is There Any Correlation With Peer Earnings?
Sometimes, peer performance can have influence on post-earnings stock reaction. In fact, the pricing-in might begin before the earnings are announced. Here is some historical data on the past post-earnings performance of JM Smucker stock compared with the stock performance of peers that reported earnings just before JM Smucker. For fair comparison, peer stock returns also represent post-earnings one-day (1D) returns.
Learn more about Trefis RV strategy that has outperformed its all-cap stocks benchmark (combination of all 3, the S&P 500, S&P mid-cap, and Russell 2000), to produce strong returns for investors.
Invest with Trefis Market-Beating Portfolios