How Will SentinelOne Stock React To Its Upcoming Earnings?

SentinelOne (NYSE:S) is set to report Q2 2026 earnings on Thursday, August 28, 2025 (January fiscal year). Revenues are expected to grow 22% year-over-year to $242 million per consensus estimates, while net losses are projected to narrow to about $0.19 per share. The company has been witnessing strong uptake for its tools focused on AI, data, cloud, and endpoint security – areas that remain crucial to enterprise IT spending despite broader macro uncertainty. SentinelOne’s Singularity platform, which leverages AI-driven automation to detect, prevent, and respond to cyber threats in real time, across both endpoints and cloud workloads is at the core of its product portfolio. This end-to-end approach differentiates SentinelOne from traditional endpoint-only vendors, while also allowing it to compete more directly with larger platforms such as CrowdStrike and Palo Alto Networks. Should you buy PANW stock?
Key operating metrics have also shown solid improvement in recent quarters. Over Q1, Annualized recurring revenue (ARR) increased 24% year-over-year to $948.1 million, underscoring the stickiness of its subscription-based model. Moreover, the number of customers with an ARR of $100,000 or more grew 22% to 1,459, indicating stronger penetration into larger enterprises and expansion within existing accounts. This momentum could continue into Q2 as well.
The company has $5.6 billion in current market capitalization. Revenue over the last twelve months was $864 million, and it was operationally loss-making with $-331 million in operating losses and net income of $-427 million. While a lot will depend on how results stack up against consensus and expectations, understanding historical patterns might just turn the odds in your favor if you are an event-driven trader.
There are two ways to do that: understand the historical odds and position yourself prior to the earnings release, or look at the correlation between immediate and medium-term returns post earnings and position yourself accordingly after the earnings are released. That said, if you seek upside with lower volatility than individual stocks, the Trefis High Quality portfolio presents an alternative – having outperformed the S&P 500 and generated returns exceeding 91% since its inception.
- SentinelOne Stock To $9?
- Sprint’s Stock Looks Expensive Compared To AT&T After Rising 93% In 2 Months!
- Sprint’s Stock Price Doubled In 15 Days; Is Market Overvaluing Sprint Just Before Its Merger With T-Mobile?
- Where Is Sprint Corp Spending Most Of Its Money?
- Machine Learning Answers: Sprint Stock Is Down 15% Over The Last Quarter, What Are The Chances It’ll Rebound?
- Sprint Valuation: Fairly Priced
See earnings reaction history of all stocks
SentinelOne’s Historical Odds Of Positive Post-Earnings Return
Some observations on one-day (1D) post-earnings returns:
- There are 15 earnings data points recorded over the last five years, with 4 positive and 11 negative one-day (1D) returns observed. In summary, positive 1D returns were seen about 27% of the time.
- However, this percentage decreases to 18% if we consider data for the last 3 years instead of 5.
- Median of the 4 positive returns = 8.5%, and median of the 11 negative returns = -5.9%
Additional data for observed 5-Day (5D) and 21-Day (21D) returns post earnings are summarized along with the statistics in the table below.
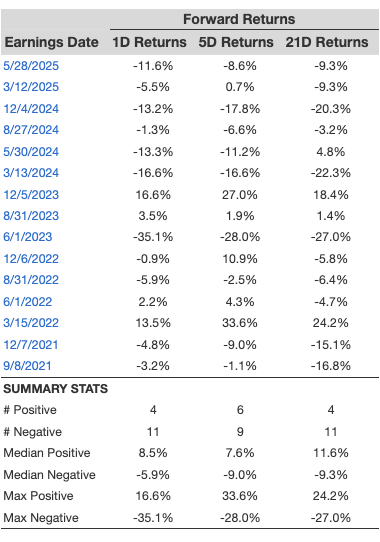
1D, 5D, and 21D Post Earnings Return
Correlation Between 1D, 5D, and 21D Historical Returns
A relatively less risky strategy (though not useful if the correlation is low) is to understand the correlation between short-term and medium-term returns post earnings, find a pair that has the highest correlation, and execute the appropriate trade. For example, if 1D and 5D show the highest correlation, a trader can position themselves “long” for the next 5 days if the 1D post-earnings return is positive. Here is some correlation data based on a 5-year and a 3-year (more recent) history. Note that the correlation 1D_5D refers to the correlation between 1D post-earnings returns and subsequent 5D returns.
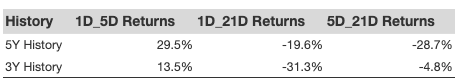
Correlation Between 1D, 5D and 21D Historical Returns
Is There Any Correlation With Peer Earnings?
Sometimes, peer performance can have an influence on post-earnings stock reaction. In fact, the pricing-in might begin before the earnings are announced. Here is some historical data on the past post-earnings performance of SentinelOne stock compared with the stock performance of peers that reported earnings just before SentinelOne. For fair comparison, peer stock returns also represent post-earnings one-day (1D) returns.
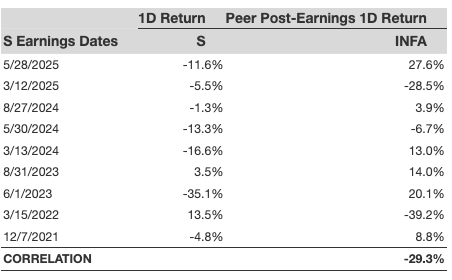
Correlation With Peer Earnings
Learn more about Trefis RV strategy that has outperformed its all-cap stocks benchmark (combination of all 3, the S&P 500, S&P mid-cap, and Russell 2000), to produce strong returns for investors. Separately, if you want upside with a smoother ride than an individual stock like SentinelOne, consider the High Quality portfolio, which has outperformed the S&P and clocked >91% returns since inception.
Invest with Trefis Market-Beating Portfolios
See all Trefis Price Estimates