How Will NYT Stock React To Its Upcoming Q1 Earnings?

The New York Times’ stock (NYSE: NYT) is scheduled to release its fiscal first-quarter earnings on Wednesday, May 7, 2025, with analysts projecting earnings of 34 cents per share on $635 million in revenue. This would represent a 42% year-over-year growth in earnings and a 7% increase in sales compared to the prior year’s figures of 24 cents per share and $594 million in revenue. Historically, the NY Times’ stock has shown a tendency to outperform following earnings announcements, having increased 60% of the time with a median one-day rise of 3.9% and a maximum observed increase of 12%.
Looking ahead to Q1 2025, NYT projects y-o-y growth of 14% to 17% in digital-only subscription revenue, alongside a mid-single-digit increase across other revenue streams. Adjusted operating costs are expected to rise by 5% to 6%, driven by planned investments in technology and content development. The company’s legal posture regarding intellectual property and its ongoing technological initiatives remain central to its strategy for sustaining competitive advantage and subscriber engagement. The NYT currently has a market capitalization of $8.5 billion. Over the past twelve months, it reported $2.6 billion in revenue, with $351 million in operating profit and $294 million in net income.
For event-driven traders, historical patterns may offer an edge, whether by positioning ahead of earnings or reacting to post-release moves. That said, if you seek upside with lower volatility than from individual stocks, the Trefis High Quality portfolio presents an alternative, having outperformed the S&P 500 and generated returns exceeding 91% since its inception. See earnings reaction history of all stocks.

- How The New York Times Quietly Became a Digital Powerhouse
- Up 6% So Far, What Lies Ahead For NY Times’ Stock Post Q2 Results?
- With A Slowdown in Advertising, What To Expect From NY Times’ Q1 Results?
- Up 47% Since Beginning of 2023, How Will NY Times’ Stock Trend After Q4 Earnings?
- Up 28% This Year, How Will NY Times’ Stock Trend Following Q3 Results?
- NY Times’ Stock To Likely See Little Movement Post Q2
 NY Times’ Historical Odds Of Positive Post-Earnings Return
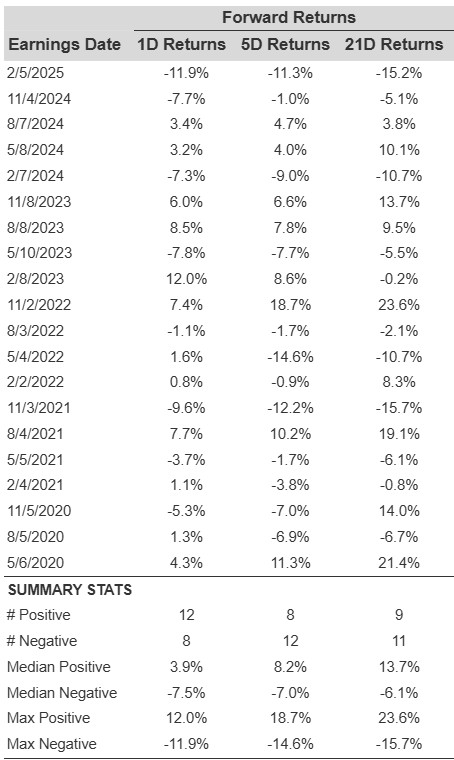
Some observations on one-day (1D) post-earnings returns:
- There are 20 earnings data points recorded over the last five years, with 12 positive and 8 negative one-day (1D) returns observed. In summary, positive 1D returns were seen about 60% of the time.
- However, this percentage decreases to 58% if we consider data for the last 3 years instead of 5.
- Median of the 12 positive returns = 3.9%, and median of the 8 negative returns = -7.5%
Additional data for observed 5-Day (5D), and 21-Day (21D) returns post earnings are summarized along with the statistics in the table below.
Correlation Between 1D, 5D, and 21D Historical Returns
A relatively less risky strategy (though not useful if the correlation is low) is to understand the correlation between short-term and medium-term returns post earnings, find a pair that has the highest correlation, and execute the appropriate trade. For example, if 1D and 5D show the highest correlation, a trader can position themselves “long” for the next 5 days if 1D post-earnings return is positive. Here is some correlation data based on 5-year and 3-year (more recent) history. Note that the correlation 1D_5D refers to the correlation between 1D post-earnings returns and subsequent 5D returns.
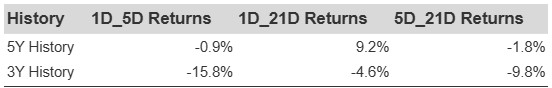
NYT Correlation Between 1D, 5D and 21D Historical Returns
Learn more about Trefis RV strategy that has outperformed its all-cap stocks benchmark (combination of all 3, the S&P 500, S&P mid-cap, and Russell 2000), to produce strong returns for investors.
Invest with Trefis Market-Beating Portfolios