How To Trade Nvidia Stock As Earnings Approach?

Nvidia (NASDAQ:NVDA) is slated to report its Q2 2026 earnings toward the end of August (January fiscal year). Consensus projects earnings of $1 per share, up from $0.68 in the same quarter last year, while revenues are estimated to grow by over 50% year-over-year to $45.60 billion. Growth is likely to be driven by continued strong demand for the company’s GPU chips used for generative AI applications. Nvidia has been ramping up large-scale production of its latest Blackwell AI supercomputers. These new chips, with their advanced AI capabilities and premium pricing, could help drive top-line growth over Q2 FY’26, while also bolstering margins. Historically, NVDA stock has shown a tendency to outperform following earnings announcements, having increased 60% of the time with a median one-day rise of 4.5% and a maximum observed increase of 24%.
Image by WikimediaImages from Pixabay
The company has $4.4 trillion in current market capitalization. Revenue over the last twelve months was $149 billion, and it was operationally profitable, with $86 billion in operating profits and net income of $77 billion. While a lot will depend on how results stack up against consensus and expectations, understanding historical patterns might just turn the odds in your favor if you are an event-driven trader. Should you Buy Or Fear Nvidia stock?
- The Two Radically Different Futures Priced Into NVIDIA Stock
- The Divergent Paths Ahead For NVIDIA Stock
- The Two Radically Different Paths Priced Into NVIDIA Stock
- Same Industry, Less Money: What First Solar and NVIDIA Offer That ON Semiconductor Does Not
- Why Is NVDA Stock The Discount Option Among Its Peers?
- Is NVIDIA’s Next Big Bet A Massive Pivot?
For event-driven traders, historical patterns may offer an edge, whether by positioning ahead of earnings or reacting to post-release moves. That said, if you seek upside with lower volatility than from individual stocks, the Trefis High Quality portfolio presents an alternative, having outperformed the S&P 500 and generated returns exceeding 91% since its inception.
See earnings reaction history of all stocks
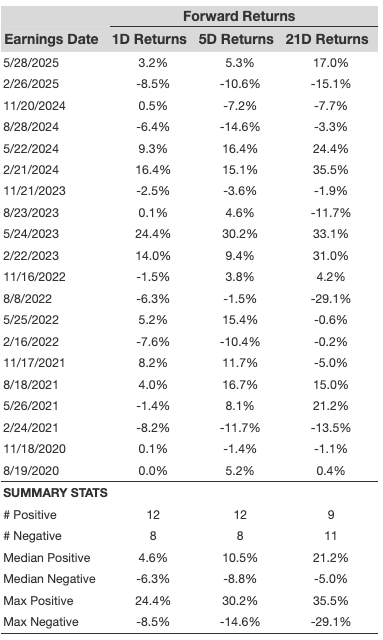
NVIDIA’s Historical Odds Of Positive Post-Earnings Return
Some observations on one-day (1D) post-earnings returns:
- There are 20 earnings data points recorded over the last five years, with 12 positive and 8 negative one-day (1D) returns observed. In summary, positive 1D returns were seen about 60% of the time.
- However, this percentage decreases to 58% if we consider data for the last 3 years instead of 5.
- Median of the 12 positive returns = 4.6%, and median of the 8 negative returns = -6.3%
Additional data for observed 5-Day (5D) and 21-Day (21D) returns post earnings are summarized along with the statistics in the table below.
Correlation Between 1D, 5D, and 21D Historical Returns
A relatively less risky strategy (though not useful if the correlation is low) is to understand the correlation between short-term and medium-term returns post earnings, find a pair that has the highest correlation, and execute the appropriate trade. For example, if 1D and 5D show the highest correlation, a trader can position themselves “long” for the next 5 days if the 1D post-earnings return is positive. Here is some correlation data based on a 5-year and a 3-year (more recent) history. Note that the correlation 1D_5D refers to the correlation between 1D post-earnings returns and subsequent 5D returns.

Is There Any Correlation With Peer Earnings?
Sometimes, peer performance can have an influence on post-earnings stock reaction. In fact, the pricing-in might begin before the earnings are announced. Here is some historical data on the past post-earnings performance of NVIDIA stock compared with the stock performance of peers that reported earnings just before NVIDIA. For fair comparison, peer stock returns also represent post-earnings one-day (1D) returns.

Learn more about Trefis RV strategy that has outperformed its all-cap stocks benchmark (combination of all 3, the S&P 500, S&P mid-cap, and Russell 2000), to produce strong returns for investors. Separately, if you want upside with a smoother ride than an individual stock like NVIDIA, consider the High Quality portfolio, which has outperformed the S&P and clocked >91% returns since inception.
Invest with Trefis Market-Beating Portfolios
See all Trefis Price Estimates