Will Medtronic Stock Rise When It Reports Earnings?

Medtronic (NYSE:MDT) is set to report its earnings on Wednesday, May 21, 2025. Over the past five years, Medtronic’s stock has experienced a positive one-day return following its earnings announcements in 53% of cases. These positive returns have had a median of 2.5% and a maximum of 4.6%.
For event-driven traders, understanding these historical patterns can potentially offer an edge, although the actual market reaction will heavily depend on how reported results compare to consensus estimates and market expectations. There are two primary approaches to leverage this historical data:
- Pre-Earnings Positioning: Analyze the historical probability of a positive or negative reaction and establish a position before the earnings release.
- Post-Earnings Positioning: Examine the correlation between the immediate market reaction to the earnings and the subsequent medium-term stock performance, then position accordingly after the announcement.
Currently, consensus estimates project Medtronic to report earnings per share of $1.58 on revenues of $8.82 billion for the upcoming quarter. This compares to the same quarter last year, where the company reported earnings per share of $1.46 on revenues of $8.59 billion.
From a fundamental perspective, Medtronic currently has a market capitalization of $110 billion. Over the trailing twelve months, the company generated $33 billion in revenue, achieving an operating profit of $6.0 billion and a net income of $4.3 billion. In addition, see Buy or Sell Medtronic Stock.
- RMD, MDT Top Revvity Stock on Price & Potential
- Large Cap Stocks Trading At 52-Week High
- Ten-Year Tally: MDT Hands Back $52 Bil to Shareholders
- Large Cap Stocks Trading At 52-Week High
- S&P 500 Movers | Winners: ADI, MCK, MDT | Losers: INTC, TGT, DELL
- How To Trade Medtronic Stock Ahead of Its Earnings?
That said, if you seek upside with lower volatility than individual stocks, the Trefis High Quality portfolio presents an alternative — having outperformed the S&P 500 and generated returns exceeding 91% since its inception.
See earnings reaction history of all stocks
Photo by Jair Lázaro on Unsplash
Medtronic’s Historical Odds Of Positive Post-Earnings Return
Some observations on one-day (1D) post-earnings returns:
- There are 19 earnings data points recorded over the last five years, with 10 positive and 9 negative one-day (1D) returns observed. In summary, positive 1D returns were seen about 53% of the time.
- However, this percentage decreases to 42% if we consider data for the last 3 years instead of 5.
- Median of the 10 positive returns = 2.5%, and median of the 9 negative returns = -4.5%
Additional data for observed 5-Day (5D), and 21-Day (21D) returns post earnings are summarized along with the statistics in the table below.
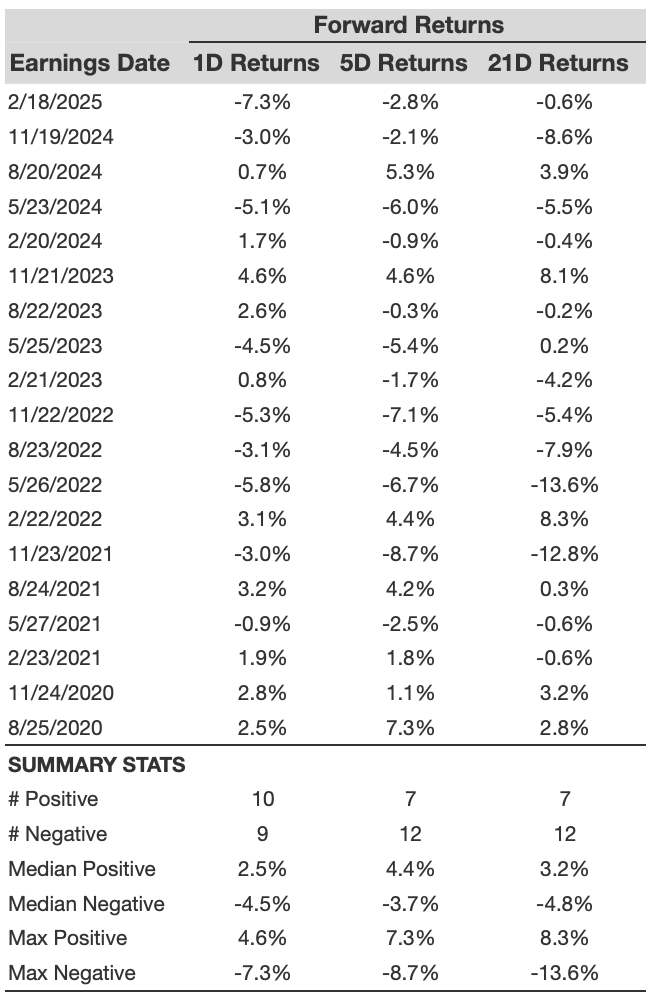
MDT 1D, 5D, and 21D Post Earnings Return
Correlation Between 1D, 5D, and 21D Historical Returns
A relatively less risky strategy (though not useful if the correlation is low) is to understand the correlation between short-term and medium-term returns post earnings, find a pair that has the highest correlation, and execute the appropriate trade. For example, if 1D and 5D show the highest correlation, a trader can position themselves “long” for the next 5 days if 1D post-earnings return is positive. Here is some correlation data based on 5-year and 3-year (more recent) history. Note that the correlation 1D_5D refers to the correlation between 1D post-earnings returns and subsequent 5D returns.
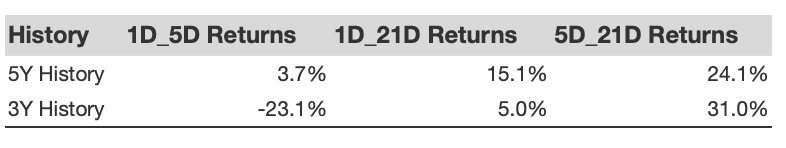
MDT Correlation Between 1D, 5D and 21D Historical Returns
Is There Any Correlation With Peer Earnings?
Sometimes, peer performance can have influence on post-earnings stock reaction. In fact, the pricing-in might begin before the earnings are announced. Here is some historical data on the past post-earnings performance of Medtronic stock compared with the stock performance of peers that reported earnings just before Medtronic. For fair comparison, peer stock returns also represent post-earnings one-day (1D) returns.
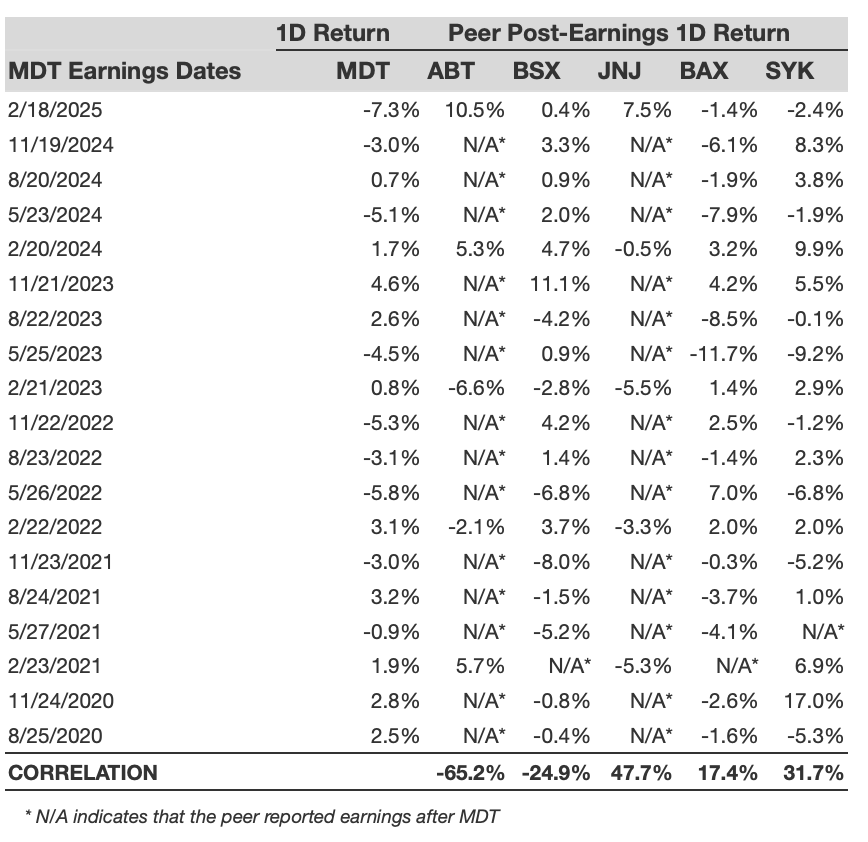
MDT Correlation With Peer Earnings
Learn more about Trefis RV strategy that has outperformed its all-cap stocks benchmark (combination of all 3, the S&P 500, S&P mid-cap, and Russell 2000), to produce strong returns for investors. Separately, if you want upside with a smoother ride than an individual stock like Medtronic, consider the High Quality portfolio, which has outperformed the S&P, and clocked >91% returns since inception.
Invest with Trefis Market-Beating Portfolios
See all Trefis Price Estimates