How To Trade Medtronic Stock Ahead of Its Earnings?

Medtronic (NYSE:MDT) is scheduled to report its earnings on Tuesday, August 19, 2025. Analysis of the last five years of data reveals that Medtronic’s stock performance on the day after its earnings release is highly unpredictable. The stock has posted a positive one-day return in 50% of instances (with a median gain of 2.5%) and a negative one-day return in the other 50% of instances (with a median loss of -3.8%). This even split suggests that the stock is not well-suited for an event-driven trading strategy.
This unpredictability is part of a broader trend of underperformance. The stock has underperformed the S&P 500 in each of the last five years. For instance, since early January 2021, the stock has barely moved, declining from around $100 to $95. In stark contrast, the S&P 500 has surged by approximately 70% over the same five-year period. This performance suggests Medtronic is not an ideal “buy-and-hold” stock.
While much depends on how the actual results compare to analyst consensus and expectations, understanding historical patterns can still be useful for an event-driven trader. There are two primary strategies to consider:
- Pre-Earnings Positioning: Base your trading decision on the historical odds before the earnings are released.
- Post-Earnings Positioning: Wait for the earnings report and analyze the correlation between the immediate and medium-term returns to make a more informed decision.
The consensus forecast for the upcoming report is earnings of $1.23 per share on sales of $8.37 billion. This would represent a flat earnings-per-share figure, but an increase in sales compared to the year-ago quarter’s earnings of $1.23 per share on sales of $7.92 billion.
- BSX, MDT Top Abbott Laboratories Stock on Price & Potential
- Medtronic Stock Near Crucial Support – Buy Signal?
- RMD Looks Smarter Buy Than Medtronic Stock
- Pay Less, Gain More: RMD, MDT Top Abbott Laboratories Stock
- Medtronic Stock Hands $28 Bil Back – Worth a Look?
- RMD, MDT Top Revvity Stock on Price & Potential
Looking at the fundamentals, Medtronic has a current market capitalization of $119 billion. Over the last twelve months, the company generated $34 billion in revenue, with a solid operating profit of $6.5 billion and a net income of $4.7 billion.
That said, if you seek upside with lower volatility than individual stocks, the Trefis High Quality portfolio presents an alternative — having outperformed the S&P 500 and generated returns exceeding 91% since its inception.
See earnings reaction history of all stocks

Image by rewind from Pixabay
Medtronic’s Historical Odds Of Positive Post-Earnings Return
Some observations on one-day (1D) post-earnings returns:
- There are 20 earnings data points recorded over the last five years, with 10 positive and 10 negative one-day (1D) returns observed. In summary, positive 1D returns were seen about 50% of the time.
- However, this percentage decreases to 42% if we consider data for the last 3 years instead of 5.
- Median of the 10 positive returns = 2.5%, and median of the 10 negative returns = -3.8%
Additional data for observed 5-Day (5D) and 21-Day (21D) returns post earnings are summarized along with the statistics in the table below.
MDT 1D, 5D, and 21D Post Earnings Return
Correlation Between 1D, 5D, and 21D Historical Returns
A relatively less risky strategy (though not useful if the correlation is low) is to understand the correlation between short-term and medium-term returns post earnings, find a pair that has the highest correlation, and execute the appropriate trade. For example, if 1D and 5D show the highest correlation, a trader can position themselves “long” for the next 5 days if the 1D post-earnings return is positive. Here is some correlation data based on a 5-year and a 3-year (more recent) history. Note that the correlation 1D_5D refers to the correlation between 1D post-earnings returns and subsequent 5D returns.
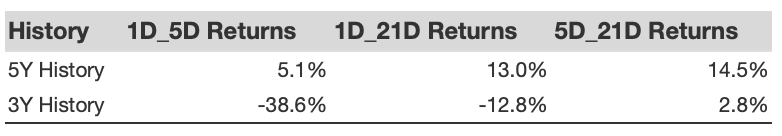
MDT Correlation Between 1D, 5D and 21D Historical Returns
Is There Any Correlation With Peer Earnings?
Sometimes, peer performance can have an influence on post-earnings stock reaction. In fact, the pricing-in might begin before the earnings are announced. Here is some historical data on the past post-earnings performance of Medtronic stock compared with the stock performance of peers that reported earnings just before Medtronic. For fair comparison, peer stock returns also represent post-earnings one-day (1D) returns.
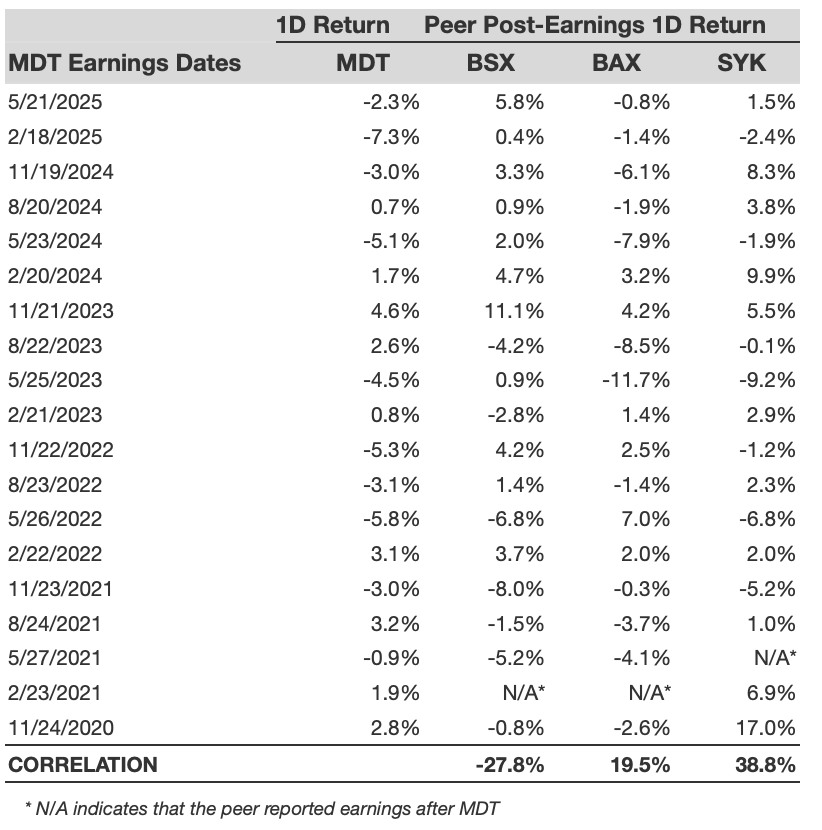
MDT Correlation With Peer Earnings
Learn more about Trefis RV strategy that has outperformed its all-cap stocks benchmark (combination of all 3, the S&P 500, S&P mid-cap, and Russell 2000), to produce strong returns for investors. Separately, if you want upside with a smoother ride than an individual stock like Medtronic, consider the High Quality portfolio, which has outperformed the S&P and clocked >91% returns since inception.
Invest with Trefis Market-Beating Portfolios
See all Trefis Price Estimates