How Might Medtronic Stock React To Upcoming Earnings?

Medtronic (NYSE:MDT) is set to report its earnings on Feb 18, 2025. While a lot will depend on how results stack up against consensus and expectations, understanding historical patterns might just turn the odds in your favor if you are an event-driven trader. There are two ways to do that – understand the historical odds and position yourself prior to the event, or look at the correlation between immediate return and medium-term return post earnings and position yourself accordingly post-event.

Image by Jorge Gonzalez from Pixabay
Medtronic’s Historical Odds Of Positive Post-Earnings Return
Some observations on one-day (1D) post earnings returns:
- RMD, MDT Top Revvity Stock on Price & Potential
- Large Cap Stocks Trading At 52-Week High
- Ten-Year Tally: MDT Hands Back $52 Bil to Shareholders
- Large Cap Stocks Trading At 52-Week High
- S&P 500 Movers | Winners: ADI, MCK, MDT | Losers: INTC, TGT, DELL
- How To Trade Medtronic Stock Ahead of Its Earnings?
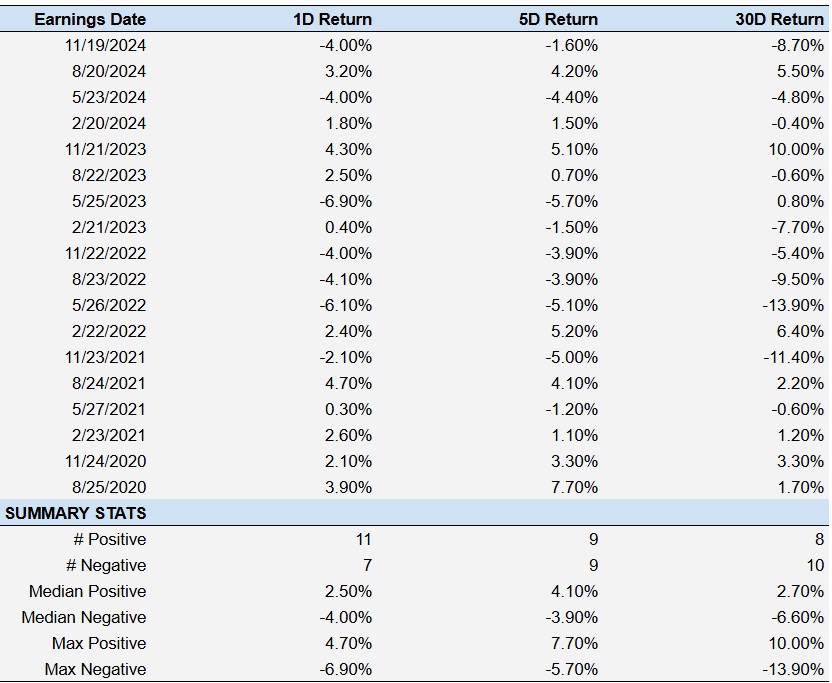
- In the past 5 years, 18 earnings data points recorded, with 11 positive and 7 negative one-day (1D) returns observed. In summary, positive 1D returns seen about 61% of the time.
- However, this percentage has decreased to 50% if we consider last 3 year data instead of 5.
- Median of the 11 positive returns = 2.5%, and median of the 7 negative returns =-4%
Additional data for observed returns 5-days (5D), and 30-days (30D) post earnings are summarized along with the statistics, in the table below.
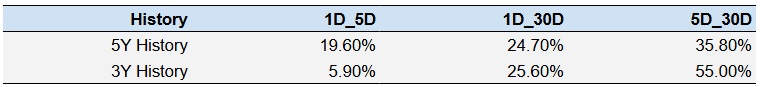
Correlation Between 1D, 5D and 30D Historical Returns
A relatively less risky strategy (though not useful if correlation is low) is to understand the correlation between short-term and medium-term returns post earnings, find a pair that has the highest correlation and execute the appropriate trade. For example, if 1D and 5D show the highest correlation, a trader can position themselves “long” for the next 4 days if 1D post-earnings return is positive. Here is some correlation data based on 5-year and 3-year (more recent) history. Note that the correlation 1D_5D refers to correlation between 1D post-earnings returns and subsequent 5D returns.
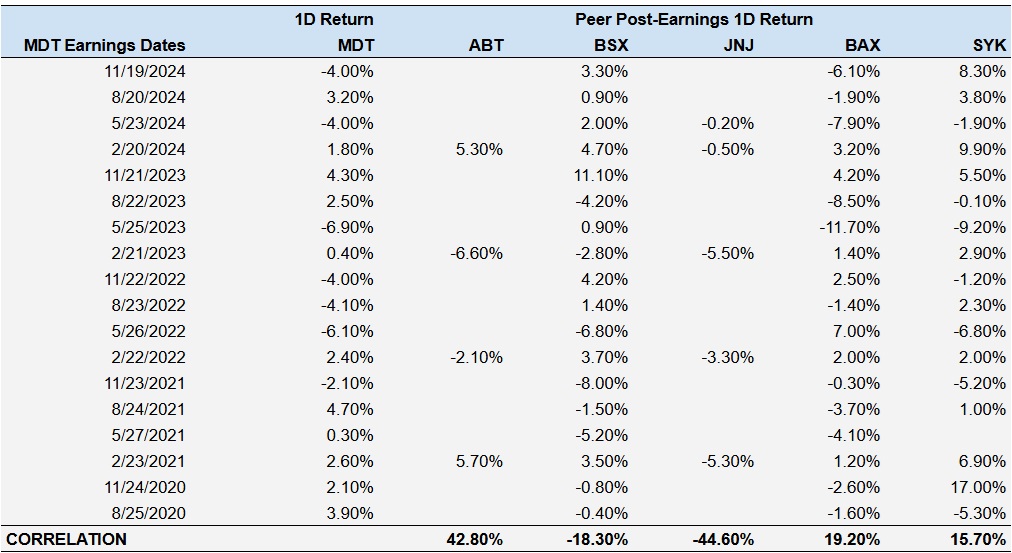
Is There Any Correlation With Peer Earnings?
Sometimes, peer performance can have influence on post-earnings stock-reaction. In fact, the pricing-in might begin before the earnings are announced. Here is some historical data on past post-earnings performance of Medtronic stock compared with stock performance of peers that reported earnings just prior to Medtronic. For fair comparison, peer stock returns also represent post-earnings one day (1D) return.
Learn more about Trefis RV strategy that has outperformed its all-cap stocks benchmark (combination of all 3, the S&P 500, S&P mid-cap, and Russell 2000), to produce strong returns for investors. Separately, if you want upside with a smoother ride than an individual stock like Medtronic, consider the High Quality portfolio, which has outperformed the S&P, and clocked >91% returns since inception.