How Will Kroger’s Stock React To Its Upcoming Earnings?
Kroger (NYSE: KR), the company that operates retail food and drug stores, multi-department stores, jewelry stores, and convenience stores throughout the United States, is scheduled to release its fiscal second-quarter earnings on Wednesday, September 10, 2025. Analysts project earnings of $1.00 per share on $34.13 billion in revenue. This would represent an 8% year-over-year increase in earnings and a marginal growth in sales compared to the prior year’s figures of $0.93 per share and $33.91 billion in revenue. Historically, KR stock has increased 60% of the time following earnings announcements, with a median one-day rise of 7.6% and a maximum observed increase of 17%.
Kroger expects FY 2025 identical sales (ex-fuel) to grow 2.25%–3.25%, with adjusted EPS of $4.60–$4.80 and free cash flow of $2.8–$3.0 billion. The company plans selective store closures, accelerated openings, continued e-commerce investment, and cost efficiencies reinvested into prices and operations to sustain growth.
The company has $45 Bil in current market capitalization. Revenue over the last twelve months was $147 Bil, and it was operationally profitable with $3.9 Bil in operating profits and net income of $2.6 Bil. While a lot will depend on how results stack up against consensus and expectations, understanding historical patterns might turn the odds in your favor if you are an event-driven trader. Separately, see Bigbear.ai: Will BBAI Stock Rebound To $10?
You can either trade based on historical odds before earnings or follow post-earnings return patterns to guide your position afterward. That said, if you seek upside with lower volatility than individual stocks, the Trefis High Quality portfolio presents an alternative – having outperformed the S&P 500 and generated returns exceeding 91% since its inception. See earnings reaction history of all stocks.
- Robinhood Stock: The Multiple Tells The Wrong Story
- How ISRG Just Secured The U.S. Market
- How UNH Stock Is Trading Short-Term Margins For Long-Term Moats
- Key Metrics To Track For Capital One After Its Q1 Earnings Miss
- Marvell Stock: The Good News Keeps Coming
- Fifth Third Earnings: Adjusted EPS Beats Despite Revenue Miss And Acquisition.

Photo by AlbanyColley on Pixabay
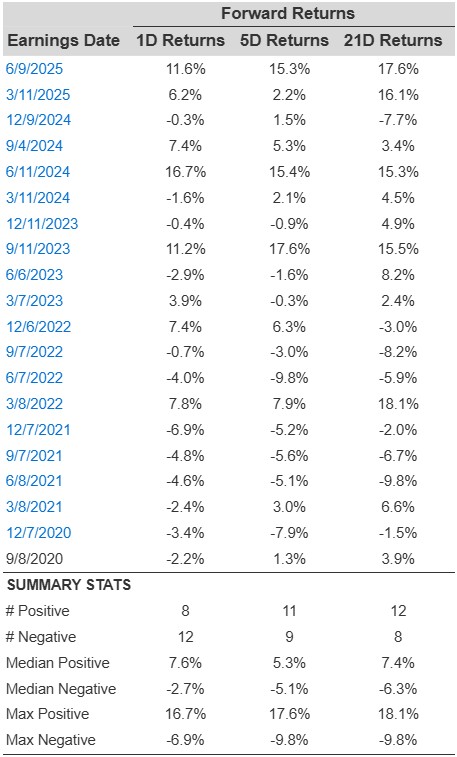
Kroger’s General Stores Historical Odds Of Positive Post-Earnings Return
Some observations on one-day (1D) post-earnings returns:
- There are 20 earnings data points recorded over the last five years, with 12 positive and 8 negative one-day (1D) returns observed. In summary, positive 1D returns were seen about 60% of the time.
- Notably, this percentage increases to 67% if we consider data for the last 3 years instead of 5.
- Median of the 12 positive returns = 6.3%, and median of the 8 negative returns = -2.8%
Additional data for observed 5-Day (5D) and 21-Day (21D) returns post earnings are summarized along with the statistics in the table below.
KR Correlation Between 1D, 5D, and 21D Forward Returns
Correlation Between 1D, 5D, and 21D Historical Returns
A relatively less risky strategy (though not useful if the correlation is low) is to understand the correlation between short-term and medium-term returns post earnings, find a pair that has the highest correlation, and execute the appropriate trade. For example, if 1D and 5D show the highest correlation, a trader can position themselves “long” for the next 5 days if 1D post-earnings return is positive. Here is some correlation data based on 5-year and 3-year (more recent) history. Note that the correlation 1D_5D refers to the correlation between 1D post-earnings returns and subsequent 5D returns.
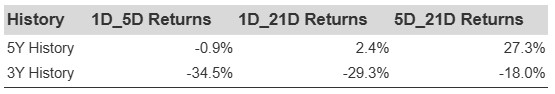
KR Correlation Between 1D, 5D, and 21D Historical Returns
Is There Any Correlation With Peer Earnings?
Sometimes, peer performance can have influence on post-earnings stock reaction. In fact, the pricing-in might begin before the earnings are announced. Here is some historical data on the past post-earnings performance of Kroger stock compared with the stock performance of peers that reported earnings just before Kroger. For fair comparison, peer stock returns also represent post-earnings one-day (1D) returns.
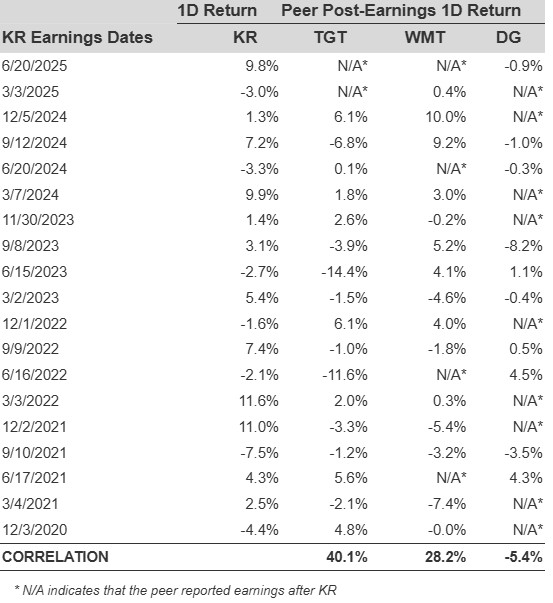
Correlation With Peers
Learn more about Trefis RV strategy that has outperformed its all-cap stocks benchmark (combination of all 3, the S&P 500, S&P mid-cap, and Russell 2000), to produce strong returns for investors.
Invest with Trefis Market-Beating Portfolios