How Will Kinder Morgan Stock React To Its Upcoming Earnings?

Kinder Morgan (NYSE: KMI) is a major energy infrastructure company focused on transporting and storing natural gas, oil, CO₂, and bulk materials. The company is set to report its fiscal third-quarter earnings on Wednesday, October 15, 2025. Analysts predict the company will report earnings of $0.30 per share on $3.98 billion in sales. This would represent a 7% increase in earnings and an 8% growth in sales compared to the previous year’s figures of $0.28 per share and $3.68 billion, respectively. Historically, the stock has declined following earnings 55% of the time, with a median one-day drop of 1.5% and a maximum decline of 6%.
With rising demand for natural gas driven by LNG exports, power generation, and AI, investors will closely watch the results. The company has $60 Bil in current market capitalization. Revenue over the last twelve months was $16 Bil, and it was operationally profitable with $4.5 Bil in operating profits and net income of $2.7 Bil. While a lot will depend on how results stack up against consensus and expectations, understanding historical patterns might just turn the odds in your favor if you are an event-driven trader.
For event-driven traders, historical patterns may offer an edge, whether by positioning ahead of earnings or reacting to post-release moves. That said, if you seek upside with lower volatility than individual stocks, the Trefis High-Quality portfolio presents an alternative, having outperformed the S&P 500 and generated returns exceeding 105% since its inception. See earnings reaction history of all stocks.

Image by Jim Black from Pixabay
- Palantir At 80x Earnings: What Revenue Growth Rate Justifies The Valuation?
- Should You Pay Attention To Chevron Stock’s Momentum?
- What Is Happening With Caterpillar Stock?
- What Can Trigger Microsoft Stock’s Slide?
- Is Microsoft Stock A Trap Or A Missed Opportunity?
- Earn 9.6% Today or Buy BSX 30% Cheaper – It’s a Win-Win
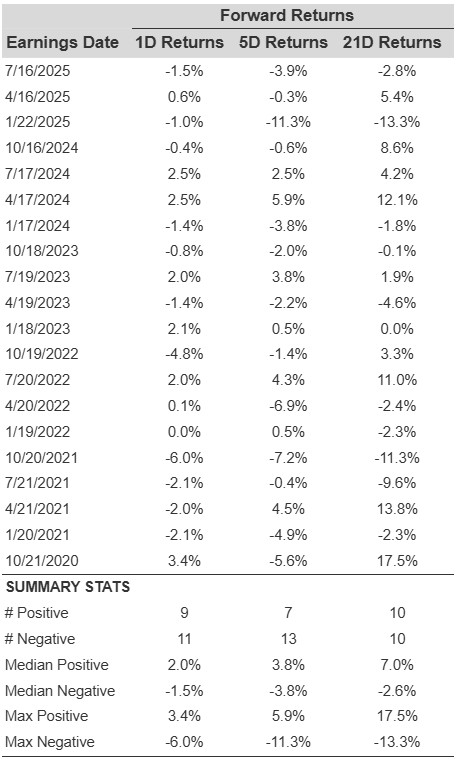
KMI’s Historical Odds Of Positive Post-Earnings Return
Some observations on one-day (1D) post-earnings returns:
- There are 20 earnings data points recorded over the last five years, with 9 positive and 11 negative one-day (1D) returns observed. In summary, positive 1D returns were seen about 45% of the time.
- However, this percentage decreases to 42% if we consider data for the last 3 years instead of 5.
- Median of the 9 positive returns = 2.0%, and median of the 11 negative returns = -1.5%
Additional data for observed 5-Day (5D) and 21-Day (21D) returns post earnings are summarized along with the statistics in the table below.
KMI Correlation Between 1D, 5D, and 21D Forward Returns
Correlation Between 1D, 5D, and 21D Historical Returns
A relatively less risky strategy (though not useful if the correlation is low) is to understand the correlation between short-term and medium-term returns post earnings, find a pair that has the highest correlation, and execute the appropriate trade. For example, if 1D and 5D show the highest correlation, a trader can position themselves “long” for the next 5 days if 1D post-earnings return is positive. Here is some correlation data based on 5-year and 3-year (more recent) history. Note that the correlation 1D_5D refers to the correlation between 1D post-earnings returns and subsequent 5D returns.
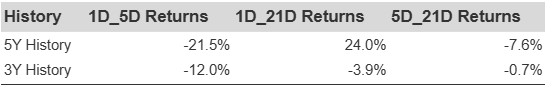
KMI Correlation Between 1D, 5D and 21D Historical Returns
Learn more about Trefis RV strategy that has outperformed its all-cap stocks benchmark (combination of all 3, the S&P 500, S&P mid-cap, and Russell 2000), to produce strong returns for investors.
Invest with Trefis Market-Beating Portfolios
See all Trefis Price Estimates