How Will JB Hunt Transport Services Stock React To Its Upcoming Earnings?

JB Hunt Transport Services (NASDAQ:JBHT) is scheduled to release its earnings report on Tuesday, July 15, 2025. Historically, JBHT has seen a positive one-day stock return following earnings announcements in 55% of instances over the past five years. The median positive return on these days was 1.4%, with a maximum one-day gain of 8.7%. For event-driven traders, understanding these historical patterns can be beneficial. There are two primary strategies:
- Pre-Earnings Positioning: Analyze historical odds and take a position before the earnings release.
- Post-Earnings Positioning: Examine the correlation between immediate and medium-term returns after earnings are released, then position yourself accordingly.
For the upcoming quarter, analysts forecast earnings of $1.32 per share and sales of $2.93 billion. These estimates align with the company’s performance in the same quarter last year. Looking at the company’s overall financial picture, it currently has a market capitalization of $15 billion. Over the last twelve months, the company generated $12 billion in revenue, with $816 million in operating profits and a net income of $561 million. That said, if you seek upside with lower volatility than individual stocks, the Trefis High Quality portfolio presents an alternative — having outperformed the S&P 500 and generated returns exceeding 91% since its inception.
See earnings reaction history of all stocks

Image by F. Muhammad from Pixabay
- Is Booking Stock Undervalued Stock Or Value Trap?
- Decoding PLTR Stock’s Premium Valuation
- Intuit Stock: Strong Cash Flow Poised for a Re-Rating?
- Five-Year Tally: Lowe’s Companies Stock Delivers $50 Bil Gain
- Five-Year Tally: Mastercard Stock Delivers $60 Bil Gain
- Palantir Technologies Stock Hits Key Support – Buying Opportunity?
JB Hunt Transport Services’ Historical Odds Of Positive Post-Earnings Return
Some observations on one-day (1D) post-earnings returns:
- There are 20 earnings data points recorded over the last five years, with 11 positive and 9 negative one-day (1D) returns observed. In summary, positive 1D returns were seen about 55% of the time.
- However, this percentage decreases to 42% if we consider data for the last 3 years instead of 5.
- Median of the 11 positive returns = 1.4%, and median of the 9 negative returns = -6.9%
Additional data for observed 5-Day (5D), and 21-Day (21D) returns post earnings are summarized along with the statistics in the table below.
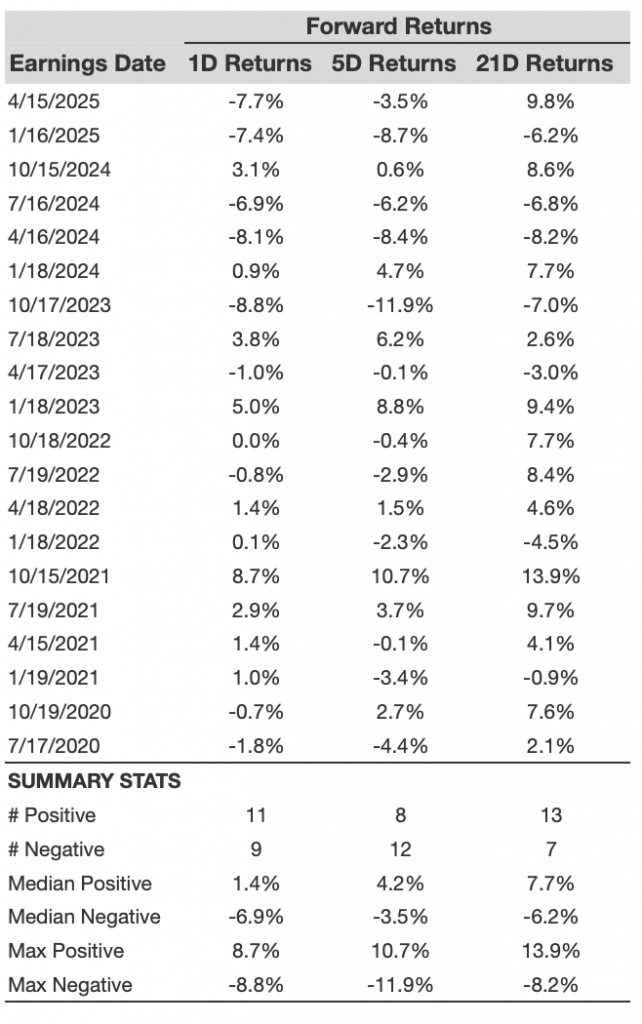
JBHT 1D, 5D, and 21D Post Earnings Return
Correlation Between 1D, 5D, and 21D Historical Returns
A relatively less risky strategy (though not useful if the correlation is low) is to understand the correlation between short-term and medium-term returns post earnings, find a pair that has the highest correlation, and execute the appropriate trade. For example, if 1D and 5D show the highest correlation, a trader can position themselves “long” for the next 5 days if 1D post-earnings return is positive. Here is some correlation data based on 5-year and 3-year (more recent) history. Note that the correlation 1D_5D refers to the correlation between 1D post-earnings returns and subsequent 5D returns.
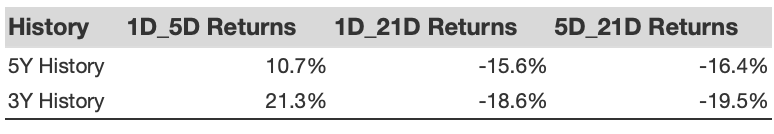
JBHT Correlation Between 1D, 5D and 21D Historical Returns
Learn more about Trefis RV strategy that has outperformed its all-cap stocks benchmark (combination of all 3, the S&P 500, S&P mid-cap, and Russell 2000), to produce strong returns for investors. Separately, if you want upside with a smoother ride than an individual stock like JB Hunt Transport Services, consider the High Quality portfolio, which has outperformed the S&P, and clocked >91% returns since inception.
Invest with Trefis Market-Beating Portfolios
See all Trefis Price Estimates