How Will Samsara Stock React To Its Upcoming Earnings?

Samsara (NYSE:IOT), a cloud-based IoT company, is scheduled to report its earnings on Thursday, June 5, 2025. For event-driven traders, understanding how the stock has historically reacted to earnings announcements can be quite insightful. Since 2022, Samsara has seen a positive one-day return in 62% of instances after results are announced, with a median gain of 14.7% and a maximum single-day positive return of 27.9%.
While the actual results compared to consensus will be the ultimate determinant, leveraging these historical patterns can potentially turn the odds in your favor. There are two main approaches: you can either understand the historical probabilities and position yourself before the earnings release, or examine the correlation between immediate and medium-term returns after the earnings are released to inform your subsequent moves.
Looking at current consensus estimates, analysts project earnings of $0.06 per share on sales of $351 million. This compares to earnings of $0.03 per share on sales of $281 million in the same quarter last year.
From a fundamental perspective, Samsara currently has a market capitalization of $26 billion. Over the last twelve months, the company generated $1.2 billion in revenue. However, it reported an operating loss of $185 million and a net loss of $155 million during that period.
- What Is The Market Really Expecting From PLTR Stock?
- What Could Push AAPL Stock Higher From Here?
- Under The Hood: The Real Range Wall Street Is Pricing For STX
- Has Amgen Stock Quietly Become a Value Opportunity?
- Ferrari’s Big Selloff Has Investors Asking: What’s The Floor?
- How Far Could AutoZone Stock Fall From Here?
That said, if you seek upside with lower volatility than individual stocks, the Trefis High Quality portfolio presents an alternative — having outperformed the S&P 500 and generated returns exceeding 91% since its inception. Separately, see – Merck Stock’s Ticking Keytruda Time Bomb
See earnings reaction history of all stocks

Image by Tayeb MEZAHDIA from Pixabay
Samsara’s Historical Odds Of Positive Post-Earnings Return
Some observations on one-day (1D) post-earnings returns:
- There are 13 earnings data points recorded over the last five years, with 8 positive and 5 negative one-day (1D) returns observed. In summary, positive 1D returns were seen about 62% of the time.
- Notably, this percentage increases to 64% if we consider data for the last 3 years instead of 5.
- Median of the 8 positive returns = 15%, and median of the 5 negative returns = -12%
Additional data for observed 5-Day (5D), and 21-Day (21D) returns post earnings are summarized along with the statistics in the table below.

IOT 1D, 5D, and 21D Post Earnings Return
Correlation Between 1D, 5D, and 21D Historical Returns
A relatively less risky strategy (though not useful if the correlation is low) is to understand the correlation between short-term and medium-term returns post earnings, find a pair that has the highest correlation, and execute the appropriate trade. For example, if 1D and 5D show the highest correlation, a trader can position themselves “long” for the next 5 days if 1D post-earnings return is positive. Here is some correlation data based on 5-year and 3-year (more recent) history. Note that the correlation 1D_5D refers to the correlation between 1D post-earnings returns and subsequent 5D returns.
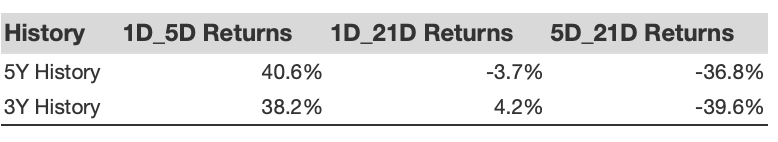
IOT Correlation Between 1D, 5D and 21D Historical Returns
Is There Any Correlation With Peer Earnings?
Sometimes, peer performance can have influence on post-earnings stock reaction. In fact, the pricing-in might begin before the earnings are announced. Here is some historical data on the past post-earnings performance of Samsara stock compared with the stock performance of peers that reported earnings just before Samsara. For fair comparison, peer stock returns also represent post-earnings one-day (1D) returns.
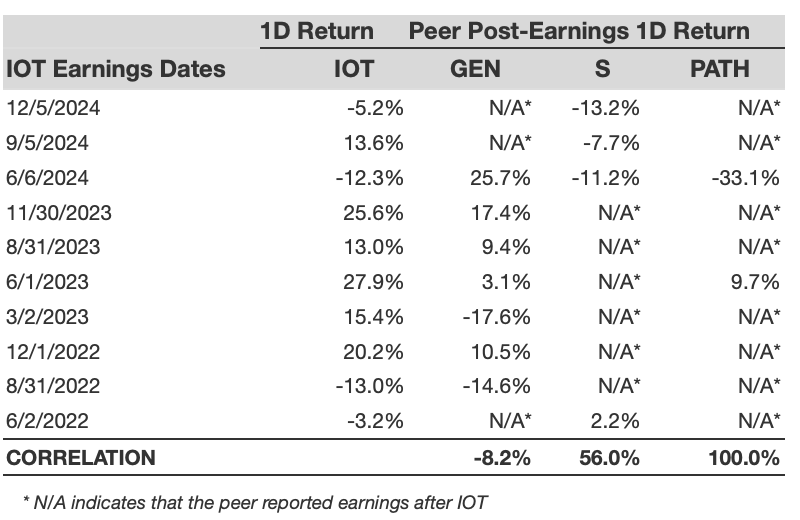
IOT Correlation With Peer Earnings
Learn more about Trefis RV strategy that has outperformed its all-cap stocks benchmark (combination of all 3, the S&P 500, S&P mid-cap, and Russell 2000), to produce strong returns for investors. Separately, if you want upside with a smoother ride than an individual stock like Samsara, consider the High Quality portfolio, which has outperformed the S&P, and clocked >91% returns since inception.
Invest with Trefis Market-Beating Portfolios
See all Trefis Price Estimates