How To Trade Deere Stock Ahead of Its Upcoming Earnings?
Deere (NYSE:DE) is scheduled to announce its earnings on Thursday, August 14, 2025. Historically, Deere’s stock has shown an equal split in its one-day performance following earnings reports over the last five years. In 50% of instances, the stock had a median negative return of -3.1%, while in the other 50%, it saw a median positive return of 5.2%. This data suggests that Deere can be a volatile stock for short-term, event-driven traders.
However, for long-term investors, the picture is quite different. Over the last five years, Deere’s stock has surged by 100%, climbing from around $255 in early January 2021 to its current price of approximately $510. This significantly outperforms the S&P 500, which saw an increase of about 70% over the same period. This implies that Deere isn’t a great stock for trading based on earnings reactions, but it is more suitable for a buy-and-hold strategy.
Still, for event-driven traders, there are two primary strategies to consider:
- Pre-Earnings: Analyze the historical odds and take a position before the earnings release.
- Post-Earnings: Evaluate the immediate and medium-term returns after the earnings are released, and then position yourself accordingly.
Now, analysts expect Deere to report earnings of $4.59 per share on sales of $10.33 billion. This would be a decrease from the same quarter last year, when the company reported earnings of $6.29 per share on revenue of $11.39 billion.
Fundamentally, the company has a current market capitalization of $138 billion. Over the last twelve months, Deere generated $44 billion in revenue, with an operating profit of $9.4 billion and a net income of $5.7 billion.
That said, if you seek upside with lower volatility than individual stocks, the Trefis High Quality portfolio presents an alternative — having outperformed the S&P 500 and generated returns exceeding 91% since its inception. Separately, see – Eli Lilly: 50% Upside For LLY Stock?
See earnings reaction history of all stocks

Image by Emslichter from Pixabay
Deere’s Historical Odds Of Positive Post-Earnings Return
Some observations on one-day (1D) post-earnings returns:
- There are 20 earnings data points recorded over the last five years, with 10 positive and 10 negative one-day (1D) returns observed. In summary, positive 1D returns were seen about 50% of the time.
- The percentage remains the same at 50% if we consider data for the last 3 years instead of 5.
- Median of the 10 positive returns = 5.2%, and median of the 10 negative returns = -3.1%
Additional data for observed 5-Day (5D) and 21-Day (21D) returns post earnings are summarized along with the statistics in the table below.
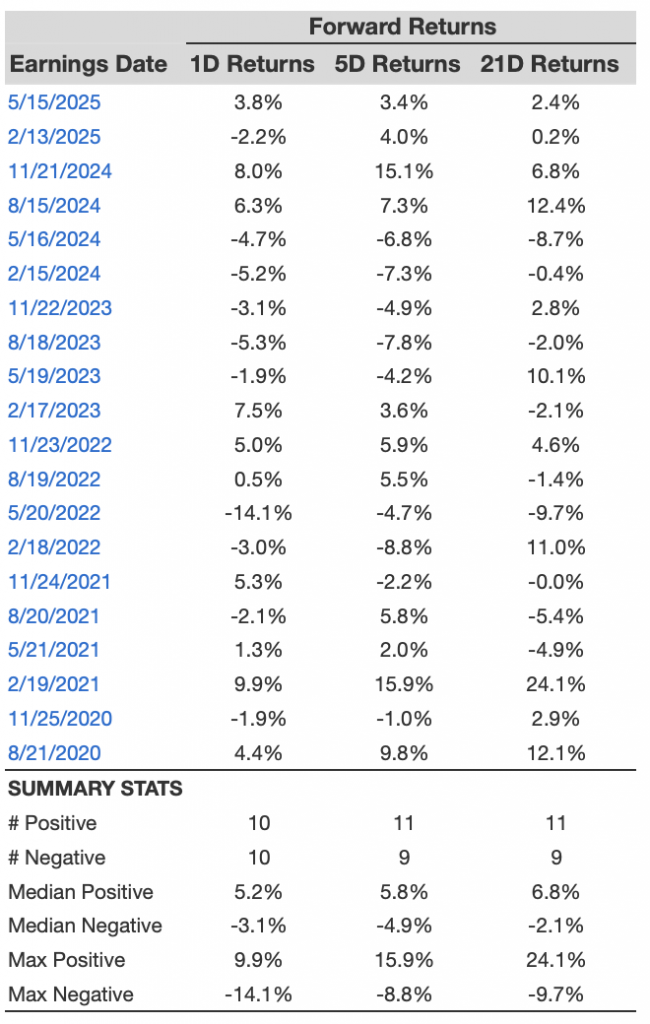
DE 1D, 5D, and 21D Post Earnings Return
Correlation Between 1D, 5D, and 21D Historical Returns
A relatively less risky strategy (though not useful if the correlation is low) is to understand the correlation between short-term and medium-term returns post earnings, find a pair that has the highest correlation, and execute the appropriate trade. For example, if 1D and 5D show the highest correlation, a trader can position themselves “long” for the next 5 days if the 1D post-earnings return is positive. Here is some correlation data based on a 5-year and a 3-year (more recent) history. Note that the correlation 1D_5D refers to the correlation between 1D post-earnings returns and subsequent 5D returns.
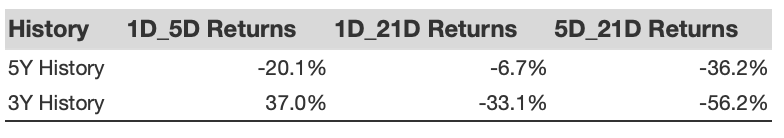
DE Correlation Between 1D, 5D and 21D Historical Returns
Is There Any Correlation With Peer Earnings?
Sometimes, peer performance can have an influence on post-earnings stock reaction. In fact, the pricing-in might begin before the earnings are announced. Here is some historical data on the past post-earnings performance of Deere stock compared with the stock performance of peers that reported earnings just before Deere. For fair comparison, peer stock returns also represent post-earnings one-day (1D) returns. Also, see – Buy or Sell DE Stock?
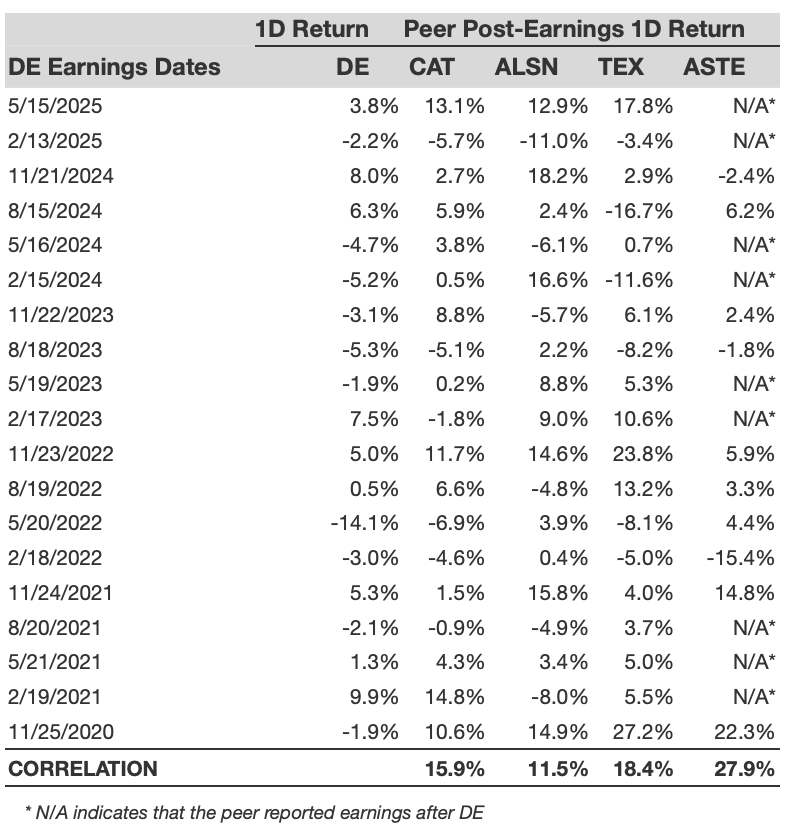
DE Correlation With Peer Earnings
Learn more about Trefis RV strategy that has outperformed its all-cap stocks benchmark (combination of all 3, the S&P 500, S&P mid-cap, and Russell 2000), to produce strong returns for investors. Separately, if you want upside with a smoother ride than an individual stock like Deere, consider the High Quality portfolio, which has outperformed the S&P and clocked >91% returns since inception.
Invest with Trefis Market-Beating Portfolios
See all Trefis Price Estimates