How Will Cleveland-Cliffs Stock React To Its Upcoming Earnings?

Cleveland-Cliffs (NYSE:CLF) is set to report its earnings on Tuesday, October 21, 2025. We expect the company to post quarterly revenues of around $5.2 billion, driven by improving steel prices and higher shipment volumes. However, we expect the company to report a loss of roughly $0.30 per share, as margins remain pressured by high energy and labor costs. Steel pricing stabilization and operational efficiencies are likely helping offset inflationary headwinds, but profitability remains challenged. While demand from automotive and infrastructure markets is supporting volumes, sustained margin recovery will depend on stronger steel prices and cost discipline over the next few quarters.
The company has $6.9 Bil in current market capitalization. Revenue over the last twelve months was $18 Bil, and it was operationally loss-making with $-1.6 Bil in operating losses and net income of $-1.7 Bil. While a lot will depend on how results stack up against consensus and expectations, understanding historical patterns might just turn the odds in your favor if you are an event-driven trader.

There are two ways to do that: understand the historical odds and position yourself prior to the earnings release, or look at the correlation between immediate and medium-term returns post earnings and position yourself accordingly after the earnings are released. That said, if you seek upside with lower volatility than individual stocks, the Trefis High Quality portfolio presents an alternative – having outperformed the S&P 500 and generated returns exceeding 105% since its inception.
See earnings reaction history of all stocks
Cleveland-Cliffs’ Historical Odds Of Positive Post-Earnings Return
Some observations on one-day (1D) post-earnings returns:
- There are 20 earnings data points recorded over the last five years, with 11 positive and 9 negative one-day (1D) returns observed. In summary, positive 1D returns were seen about 55% of the time.
- Notably, this percentage increases to 58% if we consider data for the last 3 years instead of 5.
- Median of the 11 positive returns = 6.5%, and median of the 9 negative returns = -8.9%
Additional data for observed 5-Day (5D) and 21-Day (21D) returns post earnings are summarized along with the statistics in the table below.
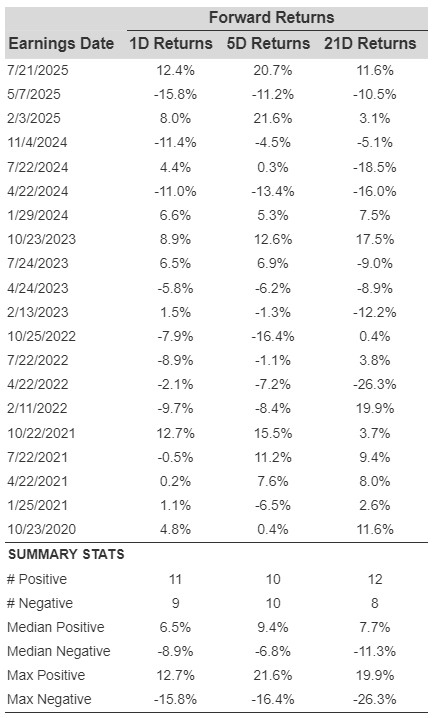
1D, 5D, and 21D Post Earnings Return
Correlation Between 1D, 5D, and 21D Historical Returns
A relatively less risky strategy (though not useful if the correlation is low) is to understand the correlation between short-term and medium-term returns post earnings, find a pair that has the highest correlation, and execute the appropriate trade. For example, if 1D and 5D show the highest correlation, a trader can position themselves “long” for the next 5 days if the 1D post-earnings return is positive. Here is some correlation data based on a 5-year and a 3-year (more recent) history. Note that the correlation 1D_5D refers to the correlation between 1D post-earnings returns and subsequent 5D returns.
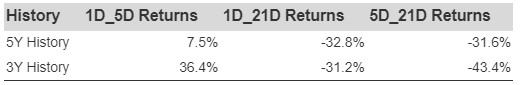
Correlation Between 1D, 5D and 21D Historical Returns
Learn more about Trefis RV strategy that has outperformed its all-cap stocks benchmark (combination of all 3, the S&P 500, S&P mid-cap, and Russell 2000), to produce strong returns for investors. Separately, if you want upside with a smoother ride than an individual stock like Cleveland-Cliffs, consider the High Quality portfolio, which has outperformed the S&P and clocked >105% returns since inception.
Invest with Trefis Market-Beating Portfolios
See all Trefis Price Estimates