How Will Arista Networks Stock React To Its Upcoming Earnings?

Arista Networks (NYSE:ANET) is set to report its earnings on Tuesday, May 6, 2025. Historically, ANET stock has shown a tendency for positive one-day returns following earnings announcements. Over the past five years, ANET has experienced a positive one-day return in 60% of instances, with a median gain of 6.1% and a maximum single-day positive return of 20.4%.
For event-driven traders, understanding these historical patterns could offer a potential advantage, although the actual market reaction will heavily depend on how the reported results compare to consensus estimates and market expectations. There are two primary strategies to consider:
- Pre-Earnings Positioning: Analyze the historical probability of positive post-earnings returns and establish a position before the announcement.
- Post-Earnings Correlation Analysis: Examine the historical correlation between immediate and medium-term stock performance after earnings releases and position accordingly.
Currently, consensus estimates predict Arista will report earnings of $0.59 per share on sales of $1.97 billion. This represents growth compared to the same quarter last year, where the company reported earnings of $0.50 per share on revenue of $1.57 billion. The anticipated growth is supported by the accelerating adoption of artificial intelligence and the expansion of data center infrastructure, which are expected to continue driving Arista’s business.
From a fundamental standpoint, Arista Networks has a current market capitalization of $111 billion. Its revenue over the last twelve months was $7.0 billion, and the company demonstrated strong operational profitability, with $2.9 billion in operating profits and a net income of $2.9 billion.
- AMD Earnings: AI-Driven Data Center Growth Signals New Era Dominance
- Cash Rich, Low Price – Upwork Stock to Break Out?
- Analog Devices Stock Shares $20 Bil Success With Investors
- eBay Stock Shares $20 Bil Success With Investors
- Fortinet Stock Pulls Back to Support – Smart Entry?
- Booking Stock Near Crucial Support – Buy Signal?
That said, if you seek upside with lower volatility than individual stocks, the Trefis High Quality portfolio presents an alternative – having outperformed the S&P 500 and generated returns exceeding 91% since its inception.
See earnings reaction history of all stocks

Photo by ArcNovaStudio on Pixabay
Arista Networks’s Historical Odds Of Positive Post-Earnings Return
Some observations on one-day (1D) post-earnings returns:
- There are 20 earnings data points recorded over the last five years, with 12 positive and 8 negative one-day (1D) returns observed. In summary, positive 1D returns were seen about 60% of the time.
- However, this percentage decreases to 55% if we consider data for the last 3 years instead of 5.
- Median of the 12 positive returns = 6.1%, and median of the 8 negative returns = -6.0%
Additional data for observed 5-Day (5D), and 21-Day (21D) returns post earnings are summarized along with the statistics in the table below.
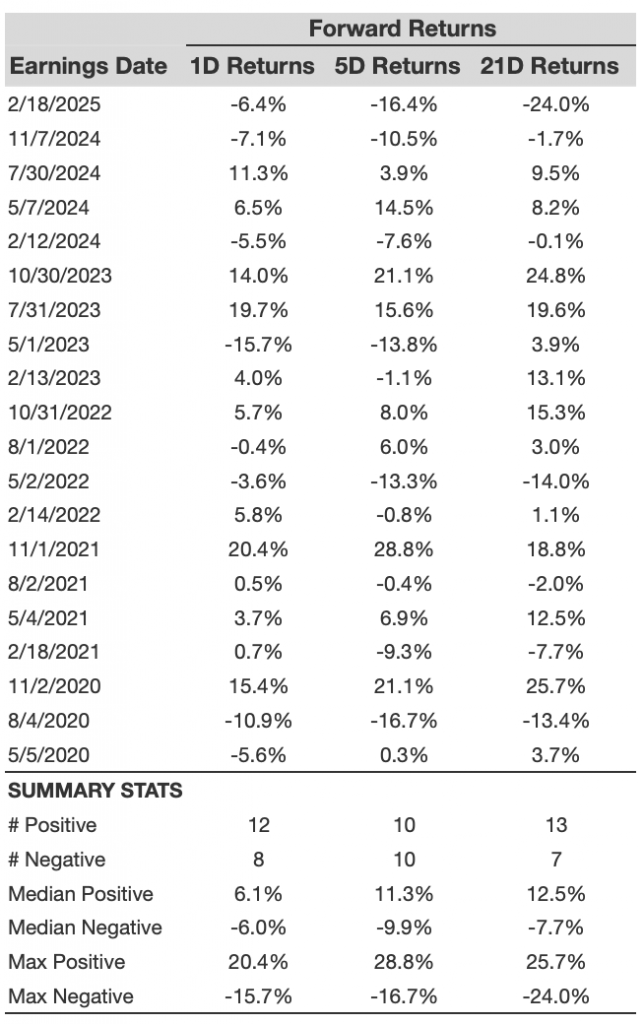
ANET 1D, 5D, and 21D Post Earnings Return
Correlation Between 1D, 5D, and 21D Historical Returns
A relatively less risky strategy (though not useful if the correlation is low) is to understand the correlation between short-term and medium-term returns post earnings, find a pair that has the highest correlation, and execute the appropriate trade. For example, if 1D and 5D show the highest correlation, a trader can position themselves “long” for the next 5 days if 1D post-earnings return is positive. Here is some correlation data based on 5-year and 3-year (more recent) history. Note that the correlation 1D_5D refers to the correlation between 1D post-earnings returns and subsequent 5D returns.
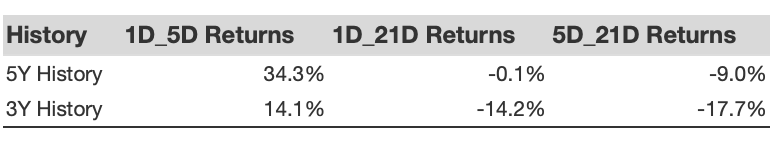
ANET Correlation Between 1D, 5D and 21D Historical Returns
Is There Any Correlation With Peer Earnings?
Sometimes, peer performance can have influence on post-earnings stock reaction. In fact, the pricing-in might begin before the earnings are announced. Here is some historical data on the past post-earnings performance of Arista Networks stock compared with the stock performance of peers that reported earnings just before Arista Networks. For fair comparison, peer stock returns also represent post-earnings one-day (1D) returns.

ANET Correlation With Peer Earnings
Learn more about Trefis RV strategy that has outperformed its all-cap stocks benchmark (combination of all 3, the S&P 500, S&P mid-cap, and Russell 2000), to produce strong returns for investors. Separately, if you want upside with a smoother ride than an individual stock like Arista Networks, consider the High Quality portfolio, which has outperformed the S&P, and clocked >91% returns since inception.
Invest with Trefis Market-Beating Portfolios
See all Trefis Price Estimates