How Will Analog Devices Stock React To Q2 Earnings?

Analog Devices (NASDAQ:ADI) is set to report its Q2 FY’25 (April 2025) earnings on Thursday, May 22. Consensus projects revenues of $2.51 billion for the quarter, up 16% year-over-year, while earnings are projected to come in at about $1.70 per share, up from $1.40 in the year-ago period. The semiconductor cycle appears to be turning around, and Analog could see improving demand from the industrial and automotive sectors, as well as higher uptake from data centers. Gross margins could also improve, driven by better volumes and easing inventory concerns.
The company has $113 billion in current market capitalization. Revenue over the last twelve months was $9.3 billion, and it was operationally profitable with $2.0 billion in operating profits and net income of $1.6 billion. That said, if you seek upside with lower volatility than individual stocks, the Trefis High Quality portfolio presents an alternative, having outperformed the S&P 500 and generated returns exceeding 91% since its inception.
See earnings reaction history of all stocks
Analog Devices’ Historical Odds Of Positive Post-Earnings Return
- Is HCA Healthcare Stock Utilizing Systematic Share Retirement for Long-Term Alpha?
- Is Booking Stock Undervalued Stock Or Value Trap?
- Decoding PLTR Stock’s Premium Valuation
- Intuit Stock: Strong Cash Flow Poised for a Re-Rating?
- Five-Year Tally: Lowe’s Companies Stock Delivers $50 Bil Gain
- Five-Year Tally: Mastercard Stock Delivers $60 Bil Gain
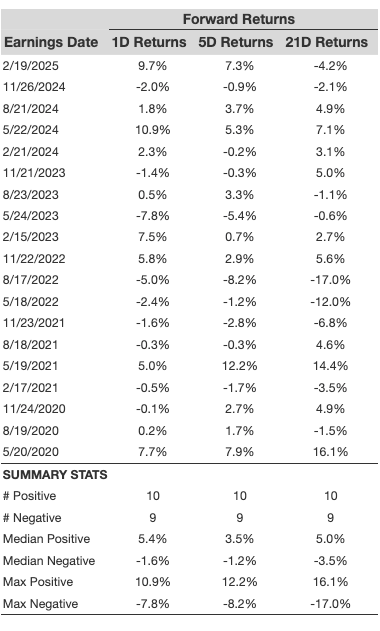
Some observations on one-day (1D) post-earnings returns:
- There are 19 earnings data points recorded over the last five years, with 10 positive and 9 negative one-day (1D) returns observed. In summary, positive 1D returns were seen about 53% of the time.
- Notably, this percentage increases to 64% if we consider data for the last 3 years instead of 5.
- Median of the 10 positive returns = 5.4%, and median of the 9 negative returns = -1.6%
Additional data for observed 5-Day (5D) and 21-Day (21D) returns post earnings are summarized along with the statistics in the table below.
This means that the stock has a slightly higher probability of an upward move post earnings. That being said, stocks can drop sharply – 20%, 30%, even 50% –as we’ve seen during past market shocks. No stock is immune. How low can ADI stock go in a market crash? It’s good to stay informed.
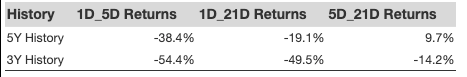
Correlation Between 1D, 5D, and 21D Historical Returns
A relatively less risky strategy (though not useful if the correlation is low) is to understand the correlation between short-term and medium-term returns post earnings, find a pair that has the highest correlation, and execute the appropriate trade. For example, if 1D and 5D show the highest correlation, a trader can position themselves “long” for the next 5 days if the 1D post-earnings return is positive. Here is some correlation data based on a 5-year and a 3-year (more recent) history. Note that the correlation 1D_5D refers to the correlation between 1D post-earnings returns and subsequent 5D returns.
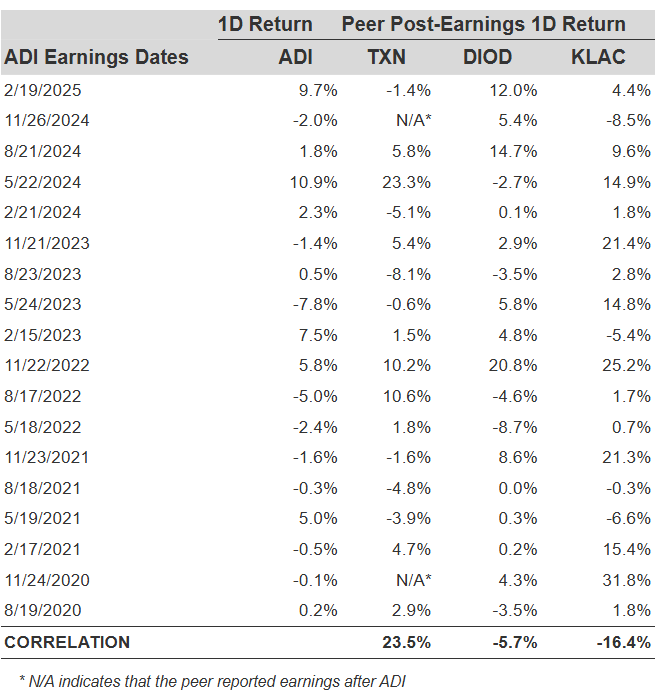
Is There Any Correlation With Peer Earnings?
Sometimes, peer performance can have influence on post-earnings stock reaction. In fact, the pricing-in might begin before the earnings are announced. Here is some historical data on the past post-earnings performance of Analog Devices stock compared with the stock performance of peers that reported earnings just before Analog Devices. For fair comparison, peer stock returns also represent post-earnings one-day (1D) returns.
Learn more about Trefis RV strategy that has outperformed its all-cap stocks benchmark (combination of all 3, the S&P 500, S&P mid-cap, and Russell 2000), to produce strong returns for investors. Separately, if you want upside with a smoother ride than an individual stock like Analog Devices, consider the High Quality portfolio, which has outperformed the S&P, and clocked >91% returns since inception.