How To Trade Apple Stock Ahead Of Q3 Earnings?

Apple (NASDAQ:AAPL) is scheduled to report its fiscal Q3 2025 earnings on Thursday, July 31. This period is typically a seasonally weaker quarter for the company, given the timing ahead of its major fall product launches. Earnings are likely to come in at around $1.42 per share, per consensus estimates, which would mark a slight increase over the same period last year, while revenues are projected to grow by 3.3% year-over-year to $88.6 billion. The modest revenue growth is likely to be driven primarily by Apple’s high-margin services segment, which includes the App Store, iCloud, Apple Music, and Apple TV+ among others. However, hardware sales may remain subdued, with overall iPhone sales likely to cool ahead of the highly anticipated iPhone 17 launch in September. That said, Apple could see some offsetting gains from the launch of its new budget-friendly iPhone 16e and refreshed M4-powered MacBooks.
We will also be watching the impact of tariffs on Apple, following the high-stakes trade war between the United States and key trading partners, particularly China. Last quarter, CEO Tim Cook warned that Apple could incur up to $900 million in additional costs during the June quarter due to tariffs. Although there have been signs of easing tensions between the U.S. and China, President Trump stated in May that Apple could face a 25% import tariff on iPhones sold in the U.S. unless the devices are manufactured domestically.
The company has $3.1 trillion in current market capitalization. Revenue over the last twelve months was $400 billion, and it was operationally profitable with $127 billion in operating profits and net income of $97 billion. While a lot will depend on how results stack up against consensus and expectations, understanding historical patterns might just turn the odds in your favor if you are an event-driven trader.
There are two ways to do that: understand the historical odds and position yourself prior to the earnings release, or look at the correlation between immediate and medium-term returns post earnings and position yourself accordingly after the earnings are released. That said, if you seek upside with lower volatility than individual stocks, the Trefis High Quality portfolio presents an alternative – having outperformed the S&P 500 and generated returns exceeding 91% since its inception.
See earnings reaction history of all stocks
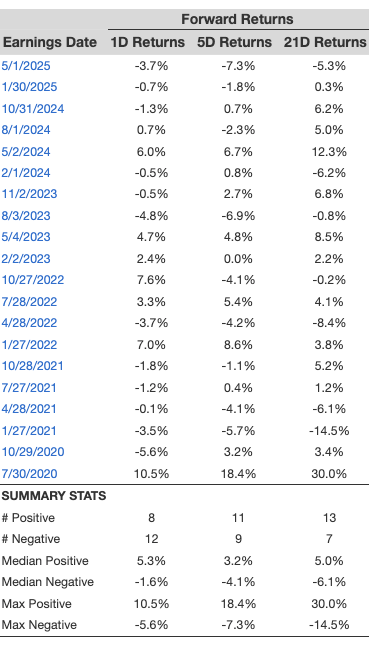
Apple’s Historical Odds Of Positive Post-Earnings Return
Some observations on one-day (1D) post-earnings returns:
- There are 20 earnings data points recorded over the last five years, with 8 positive and 12 negative one-day (1D) returns observed. In summary, positive 1D returns were seen about 40% of the time.
- Notably, this percentage increases to 50% if we consider data for the last 3 years instead of 5.
- Median of the 8 positive returns = 5.3%, and median of the 12 negative returns = -1.6%
Additional data for observed 5-Day (5D), and 21-Day (21D) returns post earnings are summarized along with the statistics in the table below.
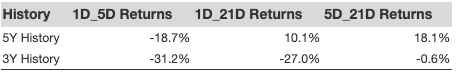
Correlation Between 1D, 5D, and 21D Historical Returns
A relatively less risky strategy (though not useful if the correlation is low) is to understand the correlation between short-term and medium-term returns post earnings, find a pair that has the highest correlation, and execute the appropriate trade. For example, if 1D and 5D show the highest correlation, a trader can position themselves “long” for the next 5 days if 1D post-earnings return is positive. Here is some correlation data based on 5-year and 3-year (more recent) history. Note that the correlation 1D_5D refers to the correlation between 1D post-earnings returns and subsequent 5D returns.
Learn more about Trefis RV strategy that has outperformed its all-cap stocks benchmark (combination of all 3, the S&P 500, S&P mid-cap, and Russell 2000), to produce strong returns for investors. Separately, if you want upside with a smoother ride than an individual stock like Apple, consider the High Quality portfolio, which has outperformed the S&P, and clocked >91% returns since inception.
Invest with Trefis Market-Beating Portfolios
See all Trefis Price Estimates