
Tandem Diabetes Care (TNDM)
Market Price (10/7/2026): $15.83 | Market Cap: $1.1 BilSector: Health Care | Industry: Health Care Equipment
Tandem Diabetes Care (TNDM)
Market Price (10/7/2026): $15.83Market Cap: $1.1 BilSector: Health CareIndustry: Health Care Equipment
Investment Highlights Why It Matters Detailed financial logic regarding cash flow yields vs trend-riding momentum.
Megatrend and thematic driversMegatrends include Aging Population & Chronic Disease, and Digital Health & Telemedicine. Themes include Diabetes Management, Remote Patient Monitoring, Show more. | Weak multi-year price returns2Y Excs Rtn is -98%, 3Y Excs Rtn is -105% Meaningful short interestShort Interest % of Basic SharesShort Interest % of Basic Shares = (Short Interest Quantity) / (Basic Shares Outstanding). A high fraction of short interest can indicate potential risk of a short squeeze. is 18% | Not profitable at operating income levelOp Inc LTMOperating Income, Last Twelve Months is -46 Mil, Op Mgn LTMOperating Margin = Operating Income / Revenue Reflects profitability before taxes and before impact of capital structure (interest payments). is -4.4% Not cash flow generativeFCF/Rev LTMFree Cash Flow / Revenue (Sales), Last Twelve Months (LTM) is -5.9% Yield minus risk free rate is negativeERPEquity Risk Premium (ERP) = Total Yield - Risk Free Rate, Reflects the premium above risk free assets offered by the investment. is -9.4% Key risksTNDM key risks include [1] eroding U.S. Show more. |
| Megatrend and thematic driversMegatrends include Aging Population & Chronic Disease, and Digital Health & Telemedicine. Themes include Diabetes Management, Remote Patient Monitoring, Show more. |
| Weak multi-year price returns2Y Excs Rtn is -98%, 3Y Excs Rtn is -105% |
| Meaningful short interestShort Interest % of Basic SharesShort Interest % of Basic Shares = (Short Interest Quantity) / (Basic Shares Outstanding). A high fraction of short interest can indicate potential risk of a short squeeze. is 18% |
| Not profitable at operating income levelOp Inc LTMOperating Income, Last Twelve Months is -46 Mil, Op Mgn LTMOperating Margin = Operating Income / Revenue Reflects profitability before taxes and before impact of capital structure (interest payments). is -4.4% |
| Not cash flow generativeFCF/Rev LTMFree Cash Flow / Revenue (Sales), Last Twelve Months (LTM) is -5.9% |
| Yield minus risk free rate is negativeERPEquity Risk Premium (ERP) = Total Yield - Risk Free Rate, Reflects the premium above risk free assets offered by the investment. is -9.4% |
| Key risksTNDM key risks include [1] eroding U.S. Show more. |
Qualitative Assessment
AI Analysis | Feedback
Tandem Diabetes Care (TNDM) stock has gained about 5% since 6/30/2026 because of the following key factors:
1. Gross margin expansion and progress towards profitability in fiscal Q2 2026 drove investor confidence. Tandem Diabetes Care reported its fiscal Q2 2026 earnings on August 6, 2026, showcasing a significant improvement in gross margin to 57%, an increase of approximately 5 percentage points year-over-year, reaching one of the highest levels in the company's history. While worldwide sales of $254.6 million slightly missed consensus estimates, the company's adjusted EBITDA margin reached 3%, marking its fourth consecutive quarter of positive adjusted EBITDA, which signaled a pathway to sustained profitability. This financial performance was a core reason for the stock's positive movement, leading to a 19% jump immediately following the earnings release.
2. Strategic product advancements and regulatory milestones expanded Tandem Diabetes Care's market potential. During fiscal Q2 2026, Tandem Diabetes Care submitted a 510(k) application to the U.S. Food and Drug Administration (FDA) for the tubeless capability of its Tandem Mobi system. The company also expanded its global portfolio by receiving FDA clearance and CE Mark for Control-IQ+ automated insulin delivery technology for use by people with type 1 diabetes during pregnancy, and CE Mark for adults with type 2 diabetes. Furthermore, compatibility was introduced for both t:slim X2 and Tandem Mobi with the Dexcom G7 15-day sensor in the U.S. and with the Abbott FreeStyle Libre 3 Plus Sensor in several European markets, enhancing product appeal and reach.
Show more
Tandem Diabetes Care (TNDM) stock has gained about 5% since 6/30/2026 because of the following key factors:
1. Gross margin expansion and progress towards profitability in fiscal Q2 2026 drove investor confidence. Tandem Diabetes Care reported its fiscal Q2 2026 earnings on August 6, 2026, showcasing a significant improvement in gross margin to 57%, an increase of approximately 5 percentage points year-over-year, reaching one of the highest levels in the company's history. While worldwide sales of $254.6 million slightly missed consensus estimates, the company's adjusted EBITDA margin reached 3%, marking its fourth consecutive quarter of positive adjusted EBITDA, which signaled a pathway to sustained profitability. This financial performance was a core reason for the stock's positive movement, leading to a 19% jump immediately following the earnings release.
2. Strategic product advancements and regulatory milestones expanded Tandem Diabetes Care's market potential. During fiscal Q2 2026, Tandem Diabetes Care submitted a 510(k) application to the U.S. Food and Drug Administration (FDA) for the tubeless capability of its Tandem Mobi system. The company also expanded its global portfolio by receiving FDA clearance and CE Mark for Control-IQ+ automated insulin delivery technology for use by people with type 1 diabetes during pregnancy, and CE Mark for adults with type 2 diabetes. Furthermore, compatibility was introduced for both t:slim X2 and Tandem Mobi with the Dexcom G7 15-day sensor in the U.S. and with the Abbott FreeStyle Libre 3 Plus Sensor in several European markets, enhancing product appeal and reach.
3. The international commercial rollout of the Tandem Mobi system broadened Tandem Diabetes Care's global footprint. Towards the end of the specified period, on September 28, 2026, Tandem Diabetes Care announced that its Tandem Mobi automated insulin delivery system, which integrates with Control-IQ+ and Dexcom G7, became available in 12 international markets across Europe and Israel. This expansion is expected to provide greater access to Tandem Diabetes Care's technology and open new avenues for high-margin recurring hardware and supplies revenue outside the United States, contributing positively to the stock's valuation.
Show less
Stock Movement Drivers
Fundamental Drivers
The 7.1% change in TNDM stock from 6/30/2026 to 10/6/2026 was primarily driven by a 6.6% change in the company's P/S Multiple.| (LTM values as of) | 6302026 | 10062026 | Change |
|---|---|---|---|
| Stock Price ($) | 15.09 | 16.16 | 7.1% |
| Change Contribution By: | |||
| Total Revenues ($ Mil) | 1,028 | 1,041 | 1.4% |
| P/S Multiple | 1.0 | 1.1 | 6.6% |
| Shares Outstanding (Mil) | 68 | 69 | -0.9% |
| Cumulative Contribution | 7.1% |
Market Drivers
6/30/2026 to 10/6/2026| Return | Correlation | |
|---|---|---|
| TNDM | 7.1% | |
| Market (SPY) | 4.3% | 2.3% |
| Sector (XLV) | 5.3% | 14.3% |
Fundamental Drivers
The -15.7% change in TNDM stock from 3/31/2026 to 10/6/2026 was primarily driven by a -16.7% change in the company's P/S Multiple.| (LTM values as of) | 3312026 | 10062026 | Change |
|---|---|---|---|
| Stock Price ($) | 19.17 | 16.16 | -15.7% |
| Change Contribution By: | |||
| Total Revenues ($ Mil) | 1,015 | 1,041 | 2.6% |
| P/S Multiple | 1.3 | 1.1 | -16.7% |
| Shares Outstanding (Mil) | 68 | 69 | -1.4% |
| Cumulative Contribution | -15.7% |
Market Drivers
3/31/2026 to 10/6/2026| Return | Correlation | |
|---|---|---|
| TNDM | -15.7% | |
| Market (SPY) | 20.1% | 14.0% |
| Sector (XLV) | 14.5% | 27.6% |
Fundamental Drivers
The 33.1% change in TNDM stock from 9/30/2025 to 10/6/2026 was primarily driven by a 31.8% change in the company's P/S Multiple.| (LTM values as of) | 9302025 | 10062026 | Change |
|---|---|---|---|
| Stock Price ($) | 12.14 | 16.16 | 33.1% |
| Change Contribution By: | |||
| Total Revenues ($ Mil) | 1,002 | 1,041 | 4.0% |
| P/S Multiple | 0.8 | 1.1 | 31.8% |
| Shares Outstanding (Mil) | 67 | 69 | -2.8% |
| Cumulative Contribution | 33.1% |
Market Drivers
9/30/2025 to 10/6/2026| Return | Correlation | |
|---|---|---|
| TNDM | 33.1% | |
| Market (SPY) | 17.9% | 16.8% |
| Sector (XLV) | 21.6% | 24.8% |
Fundamental Drivers
The -22.2% change in TNDM stock from 9/30/2023 to 10/6/2026 was primarily driven by a -37.1% change in the company's P/S Multiple.| (LTM values as of) | 9302023 | 10062026 | Change |
|---|---|---|---|
| Stock Price ($) | 20.77 | 16.16 | -22.2% |
| Change Contribution By: | |||
| Total Revenues ($ Mil) | 790 | 1,041 | 31.8% |
| P/S Multiple | 1.7 | 1.1 | -37.1% |
| Shares Outstanding (Mil) | 65 | 69 | -6.1% |
| Cumulative Contribution | -22.2% |
Market Drivers
9/30/2023 to 10/6/2026| Return | Correlation | |
|---|---|---|
| TNDM | -22.2% | |
| Market (SPY) | 88.5% | 25.5% |
| Sector (XLV) | 35.9% | 25.5% |
Price Returns Compared
| 2021 | 2022 | 2023 | 2024 | 2025 | 2026 | Total [1] | |
|---|---|---|---|---|---|---|---|
| Returns | |||||||
| TNDM Return | 57% | -70% | -34% | 22% | -39% | -25% | -83% |
| Peers Return | 27% | -3% | 11% | 4% | 14% | -8% | 51% |
| S&P 500 Return | 27% | -19% | 24% | 23% | 16% | 14% | 107% |
Monthly Win Rates [3] | |||||||
| TNDM Win Rate | 67% | 42% | 33% | 50% | 42% | 50% | |
| Peers Win Rate | 57% | 52% | 47% | 52% | 55% | 50% | |
| S&P 500 Win Rate | 75% | 42% | 67% | 75% | 67% | 50% | |
Max Drawdowns [4] | |||||||
| TNDM Max Drawdown | -26% | -76% | -69% | -49% | -73% | -55% | |
| Peers Max Drawdown | -22% | -32% | -33% | -27% | -24% | -33% | |
| S&P 500 Max Drawdown | -5% | -25% | -10% | -8% | -19% | -9% | |
[1] Cumulative total returns since the beginning of 2021
[2] Peers: PODD, MDT, DXCM, ABT, LLY. See TNDM Returns vs. Peers.
[3] Win Rate = % of calendar months in which monthly returns were positive
[4] Max drawdown represents maximum peak-to-trough decline within a year
[5] 2026 data is for the year up to 10/6/2026 (YTD)
How Low Can It Go
| Event | TNDM | S&P 500 |
|---|---|---|
| 2024 Yen Carry Trade Unwind | ||
| % Loss | -20.5% | -7.8% |
| % Gain to Breakeven | 25.8% | 8.5% |
| Time to Breakeven | 15 days | 18 days |
| Summer-Fall 2023 Five Percent Yield Shock | ||
| % Loss | -57.4% | -9.5% |
| % Gain to Breakeven | 134.5% | 10.5% |
| Time to Breakeven | 137 days | 24 days |
| 2023 SVB Regional Banking Crisis | ||
| % Loss | -42.5% | -6.7% |
| % Gain to Breakeven | 74.0% | 7.1% |
| Time to Breakeven | 302 days | 31 days |
| 2020 COVID-19 Crash | ||
| % Loss | -47.4% | -33.7% |
| % Gain to Breakeven | 90.1% | 50.9% |
| Time to Breakeven | 54 days | 140 days |
| Q4 2018 Fed Policy Error / Growth Scare | ||
| % Loss | -20.6% | -19.2% |
| % Gain to Breakeven | 25.9% | 23.8% |
| Time to Breakeven | 9 days | 105 days |
| 2016-2017 Trump Reflation Bond Selloff | ||
| % Loss | -90.1% | -3.7% |
| % Gain to Breakeven | 907.1% | 3.9% |
| Time to Breakeven | 981 days | 6 days |
In The Past
Tandem Diabetes Care's stock fell -20.5% during the 2024 Yen Carry Trade Unwind. Such a loss loss requires a 25.8% gain to breakeven.
Preserve Wealth
Limiting losses and compounding gains is essential to preserving wealth.
Asset Allocation
Actively managed asset allocation strategies protect wealth. Learn more.
| Event | TNDM | S&P 500 |
|---|---|---|
| 2024 Yen Carry Trade Unwind | ||
| % Loss | -20.5% | -7.8% |
| % Gain to Breakeven | 25.8% | 8.5% |
| Time to Breakeven | 15 days | 18 days |
| Summer-Fall 2023 Five Percent Yield Shock | ||
| % Loss | -57.4% | -9.5% |
| % Gain to Breakeven | 134.5% | 10.5% |
| Time to Breakeven | 137 days | 24 days |
| 2023 SVB Regional Banking Crisis | ||
| % Loss | -42.5% | -6.7% |
| % Gain to Breakeven | 74.0% | 7.1% |
| Time to Breakeven | 302 days | 31 days |
| 2020 COVID-19 Crash | ||
| % Loss | -47.4% | -33.7% |
| % Gain to Breakeven | 90.1% | 50.9% |
| Time to Breakeven | 54 days | 140 days |
| Q4 2018 Fed Policy Error / Growth Scare | ||
| % Loss | -20.6% | -19.2% |
| % Gain to Breakeven | 25.9% | 23.8% |
| Time to Breakeven | 9 days | 105 days |
| 2016-2017 Trump Reflation Bond Selloff | ||
| % Loss | -90.1% | -3.7% |
| % Gain to Breakeven | 907.1% | 3.9% |
| Time to Breakeven | 981 days | 6 days |
| 2015-2016 China Devaluation / Global Growth Scare | ||
| % Loss | -46.1% | -12.2% |
| % Gain to Breakeven | 85.4% | 13.9% |
| Time to Breakeven | 2034 days | 62 days |
| 2014-2016 Oil Price Collapse | ||
| % Loss | -50.5% | -6.8% |
| % Gain to Breakeven | 101.9% | 7.3% |
| Time to Breakeven | 2108 days | 15 days |
| 2011 US Debt Ceiling Crisis & European Contagion | ||
| % Loss | -44.3% | -17.9% |
| % Gain to Breakeven | 79.5% | 21.8% |
| Time to Breakeven | 784 days | 123 days |
| 2010 Eurozone Sovereign Debt Crisis / Flash Crash | ||
| % Loss | -39.7% | -15.4% |
| % Gain to Breakeven | 65.7% | 18.2% |
| Time to Breakeven | 197 days | 125 days |
| 2008-2009 Global Financial Crisis | ||
| % Loss | -34.1% | -53.4% |
| % Gain to Breakeven | 51.6% | 114.4% |
| Time to Breakeven | 82 days | 1085 days |
In The Past
Tandem Diabetes Care's stock fell -20.5% during the 2024 Yen Carry Trade Unwind. Such a loss loss requires a 25.8% gain to breakeven.
Preserve Wealth
Limiting losses and compounding gains is essential to preserving wealth.
Asset Allocation
Actively managed asset allocation strategies protect wealth. Learn more.
About Tandem Diabetes Care (TNDM)
Tandem Diabetes Care (TNDM) is a medical device company dedicated to designing, developing, and commercializing advanced products for individuals living with insulin-dependent diabetes. The company focuses on improving diabetes management through innovative technology, providing solutions that assist users in administering insulin and tracking critical health data.
The core of Tandem's product offering is the t:slim X2 insulin delivery system, a sophisticated pump platform that includes the t:slim X2 pump, disposable insulin cartridges, and infusion sets. This system often incorporates intelligent technologies such as Basal-IQ and Control-IQ, which integrate with continuous glucose monitoring (CGM) devices to automate insulin delivery. Complementing the pump, Tandem also provides the Tandem Device Updater for software updates, t:connect—a web-based data management application that consolidates therapy data from pumps, CGMs, and blood glucose meters, and the Sugarmate mobile app, offering comprehensive support for diabetes management. The company also maintains strategic development and commercialization agreements with key partners like Dexcom and Abbott Laboratories.
Tandem Diabetes Care's primary customers are people with insulin-dependent diabetes, their caregivers, and their healthcare providers. The company serves these markets both within the United States and internationally, aiming to deliver integrated solutions that simplify and enhance the daily management of diabetes.
AI Analysis | Feedback
The Apple of insulin pumps
Like Dexcom or Abbott, but providing automated insulin delivery systems instead of glucose monitoring
The Tesla of automated insulin delivery
AI Analysis | Feedback
- t:slim X2 insulin delivery system: A flagship insulin pump platform that includes the pump, disposable insulin cartridge, and infusion set for people with insulin-dependent diabetes.
- t:slim X2 insulin with Basal-IQ and Control-IQ technology: Enhanced versions of the t:slim X2 pump featuring predictive low-glucose suspend and advanced hybrid closed-loop insulin delivery.
- t:slim X2 with G5 Integration: A version of the t:slim X2 insulin pump designed for integration with the Dexcom G5 continuous glucose monitoring system.
- Tandem Device Updater: A software tool that enables users to update the software of their Tandem insulin pump.
- t:connect: A web-based data management application that visually displays diabetes therapy management data from the pump, continuous glucose monitoring, and supported blood glucose meters.
- Sugarmate: A mobile application designed for people with diabetes who use insulin.
AI Analysis | Feedback
Tandem Diabetes Care (TNDM) primarily sells its products to individuals. The major categories of customers it serves are:
- Individuals with insulin-dependent diabetes: These are the primary end-users of Tandem's core products, such as the t:slim X2 insulin delivery system, pumps, and associated technologies like Basal-IQ and Control-IQ.
- Caregivers of individuals with insulin-dependent diabetes: This category includes parents, guardians, or family members who manage or monitor the diabetes care of a user, often utilizing tools like the t:connect web-based data management application and the Sugarmate mobile app.
- Healthcare Providers: While not direct purchasers of the devices for their own use, healthcare professionals (e.g., endocrinologists, diabetes educators) are crucial customers as they prescribe, recommend, and manage therapy for individuals using Tandem's products. They also utilize the t:connect application to review patient data and optimize treatment plans.
AI Analysis | Feedback
- Dexcom, Inc. (DXCM)
- Abbott Laboratories (ABT)
AI Analysis | Feedback
AI Analysis | Feedback
Intense Market Competition
Tandem Diabetes Care operates in a highly competitive insulin pump market, facing pressure from established players like Insulet (Omnipod) and Medtronic, as well as new entrants. This competitive landscape has led to market share erosion for Tandem in the U.S. and can impact product pricing and reimbursement. The company's ability to differentiate its products and maintain strong relationships with healthcare providers and patients is crucial to navigate this environment.Product Reliability, Regulatory Hurdles, and Recalls
As a medical device company, Tandem Diabetes Care is subject to a stringent and evolving regulatory environment, particularly concerning FDA approvals. The company has experienced significant product reliability issues, including a Class I recall for its Tandem Mobi insulin pump due to a software malfunction that could interfere with insulin delivery and cause hyperglycemia. Additionally, a medical device correction was issued for certain t:slim X2 insulin pumps due to a wiring issue that could cause them to malfunction and stop delivering insulin, linked to 700 adverse events and 59 injuries. Such incidents underscore the continuous operational necessity of maintaining compliance, ensuring product reliability, and the potential impact on patient trust and brand reputation.Impact of Technological Disruption and Alternative Therapies
The diabetes technology landscape is constantly evolving, presenting a risk of technological disruption where rapid advancements or the emergence of alternative treatment modalities could render Tandem's current offerings obsolete or reduce demand for insulin pumps. Specifically, the uptake of GLP-1 drugs is identified as a competitive pressure that could shift clinical approaches to diabetes management. Furthermore, the company faces an ongoing challenge in achieving sustained profitability, having incurred significant operating losses, which could limit its ability to fund ongoing operations and invest in critical research and development to stay ahead of these technological shifts.AI Analysis | Feedback
The clear emerging threat for Tandem Diabetes Care is **Insulet's Omnipod 5 Automated Insulin Delivery (AID) System.**
Insulet's Omnipod 5, which integrates with continuous glucose monitors (CGMs) like Dexcom G6, represents a significant challenge to Tandem's t:slim X2 system. While both offer automated insulin delivery, Omnipod 5's key differentiator is its **tubeless patch pump design**. This form factor provides users with greater freedom, discretion, and a reduced burden compared to Tandem's tubed pump system. As Omnipod 5 gains market share and adoption, particularly among new pump users and those seeking alternatives to traditional tubed pumps, it directly threatens Tandem's core product by offering a fundamentally different and often preferred user experience within the same automated insulin delivery market.
AI Analysis | Feedback
Tandem Diabetes Care, Inc. (TNDM) operates primarily in the insulin pump market, a key segment of the broader diabetes device market, addressing the needs of individuals with insulin-dependent diabetes, including both Type 1 and a growing segment of Type 2 diabetes patients.
Addressable Markets:
- Global Insulin Pump Market: The global insulin pump market was valued at approximately USD 7.05 billion in 2025 and is projected to reach USD 22.45 billion by 2034, exhibiting a compound annual growth rate (CAGR) of 13.41% during the forecast period (2026-2034). Another estimate places the global insulin pump market at USD 6.05 billion in 2024, poised to grow to USD 12.32 billion by 2033 with a CAGR of 8.22% from 2026–2033.
- U.S. Insulin Pump Market: In the United States, the insulin pump market was valued at approximately USD 2.69 billion in 2025 and is expected to reach USD 3.73 billion by 2034, growing at a CAGR of 3.67% from 2026-2034. The U.S. accounted for approximately 40.8% of the global insulin pump market in 2024.
- Global Type 1 Diabetes Market: This market, which encompasses treatments and devices for Type 1 diabetes, was estimated to be valued at USD 16.97 billion in 2025 and is expected to reach USD 26.22 billion by 2032, with a CAGR of 6.4% from 2025 to 2032. Another report estimates the global Type 1 diabetes market size at USD 37.60 billion in 2025, predicted to increase to approximately USD 79.14 billion by 2035.
- Expanded Addressable Market for Type 2 Diabetes (U.S. and Global): Tandem Diabetes Care has significantly expanded its addressable market to include adults with Type 2 diabetes who require insulin, a strategic move reinforced by the FDA clearance of its Control-IQ+ technology for this population in late 2024. This expansion has "effectively more than doubled the company's addressable market". Tandem aims to increase its market share in the Type 2 diabetes segment from a current 5-10% to 20-25% during 2025. There are more than 2 million insulin-dependent Type 2 diabetes patients in the U.S., representing a potential for tens of thousands of additional insulin pump sales.
- Global Diabetes Device Market (Broader Market): The overall global diabetes device market is projected to grow significantly from an estimated USD 45.1 billion in 2024 to USD 118.6 billion by 2032, at a CAGR of 11.4%.
AI Analysis | Feedback
Drivers of Future Revenue Growth for Tandem Diabetes Care (TNDM)
- New Product Launches and Integrations: The commercialization and scaling of new products, particularly the Tandem Mobi insulin delivery system, is a significant growth driver. The Mobi system is anticipated to be a key driver of long-term margin improvement. Additionally, the ongoing integration of Tandem's pumps, like the t:slim X2 and Mobi, with advanced continuous glucose monitoring (CGM) sensors such as Dexcom G7 and Abbott FreeStyle Libre 2 Plus/3 Plus, is expected to enhance product adoption and expand the market for their automated insulin delivery (AID) systems.
- International Expansion and Direct Sales Model: Tandem Diabetes Care is actively expanding its international presence by transitioning to direct operations in key European markets, including the UK, Switzerland, and Austria, starting in early 2026. This strategic shift is designed to strengthen the company's financial position by accelerating sales growth and driving margin expansion. International sales have demonstrated robust growth, with a 35% year-over-year increase in Q1 2025.
- Growth in Customer Base and Renewals: The company anticipates continued revenue growth from its expanding installed base of customers worldwide. Strong customer retention and a high capture rate from warranty expirations are contributing to double-digit year-over-year growth in recurring supply and renewal revenue streams.
- Expansion into the Type 2 Diabetes Market: Tandem views the Type 2 diabetes population as a meaningful longer-term growth opportunity, with the potential to double its addressable market in the U.S.. The company is expanding the promotion of its Control-IQ+ technology for Type 2 diabetes following positive feedback from initial pilots.
- Pharmacy Channel Expansion and New Reimbursement Models: Tandem is focused on advancing a multichannel reimbursement strategy, including expanding access through the pharmacy channel. The shift to a "pay-as-you-go" pharmacy structure is expected to lower upfront costs for customers, enhance market share, and foster customer loyalty, thereby generating recurring revenue streams, despite potential near-term revenue recognition headwinds.
AI Analysis | Feedback
Share Repurchases
No significant share repurchase programs or dollar amounts spent on repurchases by Tandem Diabetes Care were prominently disclosed in the last 3-5 years.
Share Issuance
- In February 2026, Tandem Diabetes Care priced a private offering of $265 million in aggregate principal amount of 0.00% convertible senior notes due 2032.
- The offering was upsized from a previously announced $200 million, with an option granted to initial purchasers for an additional $35 million in notes.
- Net proceeds from this offering are estimated to be approximately $256.7 million, or about $290.7 million if the initial purchasers exercise their option in full, intended for general corporate purposes including potential acquisitions and capital expenditures.
Outbound Investments
- Tandem Diabetes has acquired four companies, including Advanced Microfluidics and Amf Medica.
- The company has also made one investment in CeQur.
Capital Expenditures
- Tandem Diabetes Care anticipates using a portion of the net proceeds from its February 2026 convertible senior notes offering for capital expenditure, among other general corporate purposes.
- The company's principal sources of cash historically have included product sales, equity offerings, and debt financing, which have been used to fund material cash requirements including capital expenditures.
- For the full year 2025, Tandem reported positive free cash flow of $3.1 million, which is defined as cash provided by operating activities less capital expenditures.
Peer Outperformance in Health Care Equipment
| Ticker | Name | Rev Growth 3Y Avg | P/E | 1Y | 3Y | 5Y | 5Y Gap |
|---|---|---|---|---|---|---|---|
| TNDM | Tandem Diabetes Care | 10.2% | -17.6x | 7.7% | -15.8% | -87.2% | — |
| ITGR | Integer | 8.4% | 33.5x | 20.0% | 60.1% | 38.2% | +125pp |
| SYK | Stryker | 9.9% | 28.6x | -23.2% | 7.8% | 10.3% | +97pp |
| BDX | Becton Dickinson | 7.1% | 52.7x | 22.5% | -7.0% | 6.4% | +94pp |
| STE | Steris | 9.8% | 25.3x | -12.3% | -4.0% | 0.8% | +88pp |
| LIVN | LivaNova | 10.7% | 21.8x | 42.4% | 39.6% | -8.1% | +79pp |
| Industry | Names | 1Y med | 3Y med | 5Y med | Top 3 by 5Y |
|---|---|---|---|---|---|
| Health Care Distributors | 6 | 14.6% | 45.3% | 93.9% | CAH 427% · MCK 373% · COR 181% |
| Health Care Facilities | 24 | 0.4% | 5.6% | 9.6% | THC 307% · NHC 280% · ENSG 140% |
| Health Care Services | 20 | 20.8% | 36.1% | 8.3% | HIMS 296% · RDNT 144% · DGX 75% |
| Managed Health Care | 8 | 27.5% | -7.2% | 3.4% | OSCR 101% · HQY 40% · ELV 13% |
| Health Care Equipment ← | 50 | -8.4% | -2.5% | -18.3% | POCI 11150% · UFPT 370% · GKOS 252% |
| Pharmaceuticals | 62 | -7.8% | -6.9% | -32.6% | INDV 1105% · ETON 1034% · LQDA 842% |
| Health Care Supplies | 11 | 12.8% | -11.8% | -42.2% | LNTH 301% · HAE 51% · MMSI 17% |
| Life Sciences Tools & Services | 109 | -10.6% | -13.2% | -64.8% | SNWV 2022% · NTRA 244% · MEDP 212% |
| Biotechnology | 362 | -18.0% | -26.3% | -79.4% | CELZ 1186% · DNTH 1091% · ELVN 1027% |
| Health Care Technology | 20 | -31.9% | -55.1% | -80.7% | SPOK 79% · HSTM 11% · VEEV -2% |
Latest Trefis Analyses
Research & Analysis
Invest in Strategies
Wealth Management
Peer Comparisons
| Peers to compare with: |
Financials
| Median | |
|---|---|
| Name | |
| Mkt Price | 91.84 |
| Mkt Cap | 70.8 |
| Rev LTM | 21,255 |
| Op Inc LTM | 4,143 |
| FCF LTM | 3,768 |
| FCF 3Y Avg | 2,087 |
| CFO LTM | 4,892 |
| CFO 3Y Avg | 4,284 |
Growth & Margins
| Median | |
|---|---|
| Name | |
| Rev Chg LTM | 12.7% |
| Rev Chg 3Y Avg | 13.1% |
| Rev Chg Q | 13.4% |
| QoQ Delta Rev Chg LTM | 3.2% |
| Op Inc Chg LTM | 46.2% |
| Op Inc Chg 3Y Avg | 34.0% |
| Op Mgn LTM | 18.0% |
| Op Mgn 3Y Avg | 17.4% |
| QoQ Delta Op Mgn LTM | 0.9% |
| CFO/Rev LTM | 21.3% |
| CFO/Rev 3Y Avg | 20.8% |
| FCF/Rev LTM | 16.6% |
| FCF/Rev 3Y Avg | 13.5% |
Valuation
| Median | |
|---|---|
| Name | |
| Mkt Cap | 70.8 |
| P/S | 3.4 |
| P/Op Inc | 20.7 |
| P/EBIT | 18.7 |
| P/E | 28.2 |
| P/CFO | 17.7 |
| Total Yield | 3.6% |
| Dividend Yield | 0.3% |
| FCF Yield 3Y Avg | 2.4% |
| D/E | 0.1 |
| Net D/E | 0.1 |
Returns
| Median | |
|---|---|
| Name | |
| 1M Rtn | -8.7% |
| 3M Rtn | 2.7% |
| 6M Rtn | -0.8% |
| 12M Rtn | -2.4% |
| 3Y Rtn | 4.6% |
| 1M Excs Rtn | -10.0% |
| 3M Excs Rtn | -0.3% |
| 6M Excs Rtn | -18.8% |
| 12M Excs Rtn | -17.1% |
| 3Y Excs Rtn | -83.7% |
Comparison Analyses
Price Behavior
| Market Price | $16.16 | |
| Market Cap ($ Bil) | 1.1 | |
| First Trading Date | 02/23/2007 | |
| Distance from 52W High | -42.8% | |
| 50 Days | 200 Days | |
| DMA Price | $19.49 | $19.38 |
| DMA Trend | down | up |
| Distance from DMA | -17.1% | -16.6% |
| 3M | 1YR | |
| Volatility | 65.2% | 77.3% |
| Downside Capture | 35.71 | 126.07 |
| Upside Capture | 51.65 | 111.94 |
| Correlation (SPY) | 3.0% | 17.2% |
| 1M | 2M | 3M | 6M | 1Y | 3Y | |
|---|---|---|---|---|---|---|
| Beta | 0.64 | 1.26 | 0.18 | 0.84 | 1.03 | 1.24 |
| Up Beta | 3.86 | 1.34 | 1.21 | 0.81 | -0.02 | 1.02 |
| Down Beta | -0.57 | -0.68 | -2.91 | 0.89 | 1.46 | 1.15 |
| Up Capture | -86% | 72% | 62% | 42% | 149% | 182% |
| Bmk +ve Days | 6 | 16 | 27 | 66 | 132 | 424 |
| Stock +ve Days | 6 | 14 | 29 | 56 | 117 | 351 |
| Down Capture | 322% | 249% | 26% | 122% | 107% | 110% |
| Bmk -ve Days | 16 | 26 | 37 | 60 | 120 | 328 |
| Stock -ve Days | 16 | 27 | 34 | 69 | 134 | 396 |
[1] Upside and downside betas calculated using positive and negative benchmark daily returns respectively
Based On 1-Year Data
| Annualized Return | Annualized Volatility | Sharpe Ratio | Correlation with TNDM | |
|---|---|---|---|---|
| TNDM | 9.9% | 77.2% | 0.43 | - |
| Sector ETF (XLV) | 16.9% | 15.7% | 0.79 | 24.2% |
| Equity (SPY) | 17.5% | 13.0% | 0.96 | 17.0% |
| Gold (GLD) | 6.9% | 29.6% | 0.23 | 10.0% |
| Commodities (DBC) | 46.1% | 20.8% | 1.71 | -7.3% |
| Real Estate (VNQ) | 2.1% | 13.7% | -0.10 | 22.5% |
| Bitcoin (BTCUSD) | -29.8% | 44.3% | -0.67 | 1.2% |
Smart multi-asset allocation framework can stack odds in your favor. Learn How
Based On 5-Year Data
| Annualized Return | Annualized Volatility | Sharpe Ratio | Correlation with TNDM | |
|---|---|---|---|---|
| TNDM | -32.8% | 68.9% | -0.28 | - |
| Sector ETF (XLV) | 7.1% | 15.2% | 0.28 | 31.5% |
| Equity (SPY) | 13.9% | 17.1% | 0.62 | 33.8% |
| Gold (GLD) | 18.7% | 18.9% | 0.80 | 8.8% |
| Commodities (DBC) | 10.3% | 19.5% | 0.40 | 1.6% |
| Real Estate (VNQ) | 1.2% | 18.8% | -0.04 | 30.4% |
| Bitcoin (BTCUSD) | 16.0% | 52.2% | 0.47 | 15.4% |
Smart multi-asset allocation framework can stack odds in your favor. Learn How
Based On 10-Year Data
| Annualized Return | Annualized Volatility | Sharpe Ratio | Correlation with TNDM | |
|---|---|---|---|---|
| TNDM | -14.9% | 78.1% | 0.16 | - |
| Sector ETF (XLV) | 10.6% | 16.7% | 0.51 | 27.7% |
| Equity (SPY) | 15.6% | 17.9% | 0.74 | 28.1% |
| Gold (GLD) | 11.6% | 16.4% | 0.58 | 4.7% |
| Commodities (DBC) | 8.3% | 18.1% | 0.37 | 6.3% |
| Real Estate (VNQ) | 4.2% | 20.7% | 0.16 | 22.0% |
| Bitcoin (BTCUSD) | 64.1% | 66.2% | 1.04 | 8.0% |
Smart multi-asset allocation framework can stack odds in your favor. Learn How
Earnings Returns History
Updated 9/9/2026| Forward Returns | |||
|---|---|---|---|
| Earnings Date | 1D Returns | 5D Returns | 21D Returns |
| 8/6/2026 | 19.1% | 23.1% | 5.9% |
| 5/7/2026 | -16.2% | -23.4% | 0.0% |
| 2/19/2026 | 32.7% | 39.3% | 34.0% |
| 11/6/2025 | 22.0% | 31.5% | 53.3% |
| 8/6/2025 | -19.9% | -22.7% | -12.6% |
| 4/30/2025 | 18.6% | 32.1% | 17.6% |
| 2/26/2025 | -35.2% | -43.1% | -41.0% |
| 11/6/2024 | -2.7% | -13.3% | -12.1% |
| ... | |||
| SUMMARY STATS | |||
| # Positive | 8 | 7 | 10 |
| # Negative | 10 | 11 | 8 |
| Median Positive | 18.8% | 23.1% | 21.5% |
| Median Negative | -15.0% | -19.6% | -24.8% |
| Max Positive | 32.7% | 39.3% | 53.3% |
| Max Negative | -35.2% | -43.1% | -41.0% |
| Forward Returns | |||
|---|---|---|---|
| Earnings Date | 1D Returns | 5D Returns | 21D Returns |
| 8/6/2026 | 19.1% | 23.1% | 5.9% |
| 5/7/2026 | -16.2% | -23.4% | 0.0% |
| 2/19/2026 | 32.7% | 39.3% | 34.0% |
| 11/6/2025 | 22.0% | 31.5% | 53.3% |
| 8/6/2025 | -19.9% | -22.7% | -12.6% |
| 4/30/2025 | 18.6% | 32.1% | 17.6% |
| 2/26/2025 | -35.2% | -43.1% | -41.0% |
| 11/6/2024 | -2.7% | -13.3% | -12.1% |
| 8/1/2024 | 18.3% | 4.7% | 23.5% |
| 5/2/2024 | 22.3% | 20.5% | 42.2% |
| 2/21/2024 | 10.9% | 17.9% | 41.3% |
| 11/1/2023 | -14.4% | -12.6% | 19.4% |
| 8/3/2023 | 4.4% | -8.4% | -12.9% |
| 5/3/2023 | -6.1% | -16.6% | -38.0% |
| 2/22/2023 | -4.7% | -8.3% | 4.2% |
| 11/2/2022 | -28.4% | -29.9% | -16.7% |
| 8/3/2022 | -15.0% | -19.6% | -35.3% |
| 5/4/2022 | -15.0% | -26.2% | -32.8% |
| SUMMARY STATS | |||
| # Positive | 8 | 7 | 10 |
| # Negative | 10 | 11 | 8 |
| Median Positive | 18.8% | 23.1% | 21.5% |
| Median Negative | -15.0% | -19.6% | -24.8% |
| Max Positive | 32.7% | 39.3% | 53.3% |
| Max Negative | -35.2% | -43.1% | -41.0% |
SEC Filings
Expand for More| Report Date | Filing Date | Filing |
|---|---|---|
| 06/30/2026 | 08/06/2026 | 10-Q |
| 03/31/2026 | 05/07/2026 | 10-Q |
| 12/31/2025 | 02/19/2026 | 10-K |
| 09/30/2025 | 11/06/2025 | 10-Q |
| 06/30/2025 | 08/06/2025 | 10-Q |
| 03/31/2025 | 04/30/2025 | 10-Q |
| 12/31/2024 | 02/26/2025 | 10-K |
| 09/30/2024 | 11/06/2024 | 10-Q |
| 06/30/2024 | 08/01/2024 | 10-Q |
| 03/31/2024 | 05/02/2024 | 10-Q |
| 12/31/2023 | 02/21/2024 | 10-K |
| 09/30/2023 | 11/01/2023 | 10-Q |
| 06/30/2023 | 08/03/2023 | 10-Q |
| 03/31/2023 | 05/03/2023 | 10-Q |
| 12/31/2022 | 02/22/2023 | 10-K |
| 09/30/2022 | 11/02/2022 | 10-Q |
| Report Date | Filing Date | Filing |
|---|---|---|
| 06/30/2026 | 08/06/2026 | 10-Q |
| 03/31/2026 | 05/07/2026 | 10-Q |
| 12/31/2025 | 02/19/2026 | 10-K |
| 09/30/2025 | 11/06/2025 | 10-Q |
| 06/30/2025 | 08/06/2025 | 10-Q |
| 03/31/2025 | 04/30/2025 | 10-Q |
| 12/31/2024 | 02/26/2025 | 10-K |
| 09/30/2024 | 11/06/2024 | 10-Q |
| 06/30/2024 | 08/01/2024 | 10-Q |
| 03/31/2024 | 05/02/2024 | 10-Q |
| 12/31/2023 | 02/21/2024 | 10-K |
| 09/30/2023 | 11/01/2023 | 10-Q |
| 06/30/2023 | 08/03/2023 | 10-Q |
| 03/31/2023 | 05/03/2023 | 10-Q |
| 12/31/2022 | 02/22/2023 | 10-K |
| 09/30/2022 | 11/02/2022 | 10-Q |
| 06/30/2022 | 08/03/2022 | 10-Q |
| 03/31/2022 | 05/04/2022 | 10-Q |
| 12/31/2021 | 02/22/2022 | 10-K |
| 09/30/2021 | 11/03/2021 | 10-Q |
| 06/30/2021 | 08/04/2021 | 10-Q |
| 03/31/2021 | 05/05/2021 | 10-Q |
| 12/31/2020 | 02/24/2021 | 10-K |
| 09/30/2020 | 11/05/2020 | 10-Q |
| 06/30/2020 | 07/30/2020 | 10-Q |
| 03/31/2020 | 04/30/2020 | 10-Q |
| 12/31/2019 | 02/24/2020 | 10-K |
| 09/30/2019 | 11/04/2019 | 10-Q |
Recent Forward Guidance
Updated 10/4/2026Latest: Q2 2026 Earnings Reported 8/6/2026
| Forward Guidance | Guidance Change | |||||||
|---|---|---|---|---|---|---|---|---|
| Metric | Source | Low | Mid | High | % Chg | % Delta | Change | Prior |
| 2026 Non-cash charges | Reported | 85.00 Mil | ||||||
| 2026 Stock-based compensation expense | Reported | 65.00 Mil | ||||||
| 2026 Depreciation and amortization expense | Reported | 20.00 Mil | ||||||
| 2026 Sales | Reported | 1.06 Bil | 1.07 Bil | 1.08 Bil | 0 | Affirmed | Guidance: 1.07 Bil for 2026 | |
| 2026 U.S. Sales | Reported | 730.00 Mil | 737.50 Mil | 745.00 Mil | 0 | Affirmed | Guidance: 737.50 Mil for 2026 | |
| 2026 International Sales | Reported | 335.00 Mil | 337.50 Mil | 340.00 Mil | 0 | Affirmed | Guidance: 337.50 Mil for 2026 | |
| 2026 Gross Profit | Calculated | 596.40 Mil | 607.38 Mil | 618.45 Mil | Rev x Gross Margin | |||
| 2026 Gross Margin | Reported | 56.0% | 56.5% | 57.0% | 0 | Affirmed | Guidance: 56.5% for 2026 | |
| 2026 Adjusted EBITDA Margin | Reported | 5.0% | 5.5% | 6.0% | 0 | Affirmed | Guidance: 5.5% for 2026 | |
Prior: Q1 2026 Earnings Reported 5/7/2026
| Forward Guidance | Guidance Change | |||||||
|---|---|---|---|---|---|---|---|---|
| Metric | Source | Low | Mid | High | % Chg | % Delta | Change | Prior |
| 2026 Revenue | Reported | 1.06 Bil | 1.07 Bil | 1.08 Bil | 0 | Affirmed | Guidance: 1.07 Bil for 2026 | |
| 2026 United States Sales | Reported | 730.00 Mil | 737.50 Mil | 745.00 Mil | 0 | Affirmed | Guidance: 737.50 Mil for 2026 | |
| 2026 International Sales | Reported | 335.00 Mil | 337.50 Mil | 340.00 Mil | 0 | Affirmed | Guidance: 337.50 Mil for 2026 | |
| 2026 Gross Profit | Calculated | 596.40 Mil | 607.38 Mil | 618.45 Mil | Rev x Gross Margin | |||
| 2026 Gross Margin | Reported | 56.0% | 56.5% | 57.0% | 0 | Affirmed | Guidance: 56.5% for 2026 | |
| 2026 Adjusted EBITDA Margin | Reported | 5.0% | 5.5% | 6.0% | 0 | Affirmed | Guidance: 5.5% for 2026 | |
Q4 2025 Earnings Reported 2/19/2026
| Forward Guidance | Guidance Change | |||||||
|---|---|---|---|---|---|---|---|---|
| Metric | Source | Low | Mid | High | % Chg | % Delta | Change | Prior |
| 2026 Non-cash charges | Reported | |||||||
| 2026 Revenue | Reported | 1.06 Bil | 1.07 Bil | 1.08 Bil | 7.5% | Higher New | Guidance: 1.00 Bil for 2025 | |
| 2026 United States Sales | Reported | 730.00 Mil | 737.50 Mil | 745.00 Mil | 5.4% | Higher New | Guidance: 700.00 Mil for 2025 | |
| 2026 International Sales | Reported | 335.00 Mil | 337.50 Mil | 340.00 Mil | 12.5% | Higher New | Guidance: 300.00 Mil for 2025 | |
| 2026 Gross Profit | Calculated | 596.40 Mil | 607.38 Mil | 618.45 Mil | Rev x Gross Margin | |||
| 2026 Gross Margin | Reported | 56.0% | 56.5% | 57.0% | 3.0% | Higher New | Guidance: 53.5% for 2025 | |
| 2026 Adjusted EBITDA Margin | Reported | 5.0% | 5.5% | 6.0% | 10.5% | Higher New | Guidance: -5.0% for 2025 | |
Q3 2025 Earnings Reported 11/6/2025
| Forward Guidance | Guidance Change | |||||||
|---|---|---|---|---|---|---|---|---|
| Metric | Source | Low | Mid | High | % Chg | % Delta | Change | Prior |
| 2025 Non-cash charges | Reported | 115.00 Mil | 0 | Affirmed | Guidance: 115.00 Mil for 2025 | |||
| 2025 Revenue | Reported | 1.00 Bil | 0 | Affirmed | Guidance: 1.00 Bil for 2025 | |||
| 2025 U.S. Sales | Reported | 700.00 Mil | 0 | Affirmed | Guidance: 700.00 Mil for 2025 | |||
| 2025 International Sales | Reported | 300.00 Mil | 0 | Affirmed | Guidance: 300.00 Mil for 2025 | |||
| 2025 Gross Profit | Calculated | 530.00 Mil | 535.00 Mil | 540.00 Mil | Rev x Gross Margin | |||
| 2025 Gross Margin | Reported | 53.0% | 53.5% | 54.0% | 0 | Affirmed | Guidance: 53.5% for 2025 | |
| 2025 Adjusted EBITDA Margin | Reported | -5.0% | 0 | Affirmed | Guidance: -5.0% for 2025 | |||
Insider Activity
Updated 8/18/2026| # | Owner | Title | Holding | Action | Filing Date | Price | Shares | Transacted Value | Value of Held Shares | Form |
|---|---|---|---|---|---|---|---|---|---|---|
| 1 | Novara, Mark David | EVP & CHIEF COMMERCIAL OFFICER | Direct | Sell | 3182026 | 23.05 | 187 | 4,310 | 867,971 | Form |
| 2 | Novara, Mark David | EVP & CHIEF COMMERCIAL OFFICER | Direct | Sell | 3092026 | 22.81 | 2 | 46 | 820,453 | Form |
| 3 | Sheridan, John F | PRESIDENT & CEO | Direct | Buy | 8112025 | 10.23 | 10,000 | 102,318 | 1,087,917 | Form |
| 4 | Vosseller, Leigh | EVP & CHIEF FINANCIAL OFFICER | Leigh A. Vosseller Trust | Buy | 8112025 | 10.89 | 13,720 | 149,404 | 278,553 | Form |
| # | Owner | Title | Holding | Action | Filing Date | Price | Shares | Transacted Value | Value of Held Shares | Form |
|---|---|---|---|---|---|---|---|---|---|---|
| 1 | Novara, Mark David | EVP & CHIEF COMMERCIAL OFFICER | Direct | Sell | 3182026 | 23.05 | 187 | 4,310 | 867,971 | Form |
| 2 | Novara, Mark David | EVP & CHIEF COMMERCIAL OFFICER | Direct | Sell | 3092026 | 22.81 | 2 | 46 | 820,453 | Form |
| 3 | Sheridan, John F | PRESIDENT & CEO | Direct | Buy | 8112025 | 10.23 | 10,000 | 102,318 | 1,087,917 | Form |
| 4 | Vosseller, Leigh | EVP & CHIEF FINANCIAL OFFICER | Leigh A. Vosseller Trust | Buy | 8112025 | 10.89 | 13,720 | 149,404 | 278,553 | Form |
Investor Activity (13F)
Updated Oct 7, 2026Active managers (13F portfolio over $250M, at least 3 holdings) with a position over $5M that is either over 10% of their portfolio or held in a concentrated book of 50 or fewer total positions. Index/ETF, sovereign, bank, community-bank and charitable/donor-advised filers are excluded.
| Active Manager | Value | % of Portfolio | Total Positions | QoQ | Filing |
|---|---|---|---|---|---|
| Paradice Investment Management LLC | $39.2 Mil | 7.4% | 23 | Hold | 13F |
| First Light Asset Management, LLC | $25.2 Mil | 2.3% | 35 | ADD +20.7% | 13F |
| Defilade Capital Management, L.P. | $14.6 Mil | 2.1% | 31 | New | 13F |
| Sessa Capital IM, L.P. | $90.7 Mil | 1.7% | 31 | TRIM -5.4% | 13F |
| Sector Gamma AS | $5.1 Mil | 1.2% | 42 | Hold | 13F |
| Active Manager | Value | % of Portfolio | Total Positions | QoQ | Filing |
|---|---|---|---|---|---|
| Sessa Capital IM, L.P. | $90.7 Mil | 1.7% | 31 | TRIM -5.4% | 13F |
| Paradice Investment Management LLC | $39.2 Mil | 7.4% | 23 | Hold | 13F |
| First Light Asset Management, LLC | $25.2 Mil | 2.3% | 35 | ADD +20.7% | 13F |
| Defilade Capital Management, L.P. | $14.6 Mil | 2.1% | 31 | New | 13F |
| Sector Gamma AS | $5.1 Mil | 1.2% | 42 | Hold | 13F |
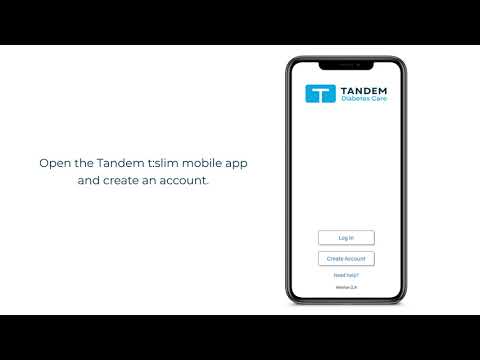
Tandem Diabetes Care — Investor Video Playlist


External Quote Links
| Y Finance | Barrons |
| TradingView | Morningstar |
| SeekingAlpha | ValueLine |
| Motley Fool | Robinhood |
| CNBC | Etrade |
| MarketWatch | Unusual Whales |
| YCharts | Perplexity Finance |
| FinViz |
Prefer one of these to Trefis? Tell us why.