
Taylor Morrison Home (TMHC)
Market Price (7/24/2026): $72.455 | Market Cap: $7.0 BilSector: Consumer Discretionary | Industry: Homebuilding
Taylor Morrison Home (TMHC)
Market Price (7/24/2026): $72.455Market Cap: $7.0 BilSector: Consumer DiscretionaryIndustry: Homebuilding
Investment Highlights Why It Matters Detailed financial logic regarding cash flow yields vs trend-riding momentum.
Attractive yieldTotal YieldTotal Yield = Earnings Yield + Dividend Yield, Earnings Yield = Net Income / Market Cap Dividend Yield = Total Dividends / Market Cap is 9.6%, ERPEquity Risk Premium (ERP) = Total Yield - Risk Free Rate, Reflects the premium above risk free assets offered by the investment. is 5.3%, FCF Yield is 9.9% Stock buyback supportStock Buyback 3Y Total is 1.0 Bil Low stock price volatilityVol 12M is 37% Megatrend and thematic driversMegatrends include Sustainable & Green Buildings, and Smart Buildings & Proptech. Themes include Energy Efficient Building Materials, IoT for Buildings, Show more. | Trading close to highsDist 52W High is 0.0%, Dist 3Y High is -3.1% | Weak revenue growthRev Chg LTMRevenue Change % Last Twelve Months (LTM) is -9.0%, Rev Chg 3Y AvgRevenue Change % averaged over trailing 3 years is -1.9%, Rev Chg QQuarterly Revenue Change % is -27% Key risksTMHC key risks include [1] a significant slowdown in its order backlog and [2] persistently high cancellation rates, Show more. |
| Attractive yieldTotal YieldTotal Yield = Earnings Yield + Dividend Yield, Earnings Yield = Net Income / Market Cap Dividend Yield = Total Dividends / Market Cap is 9.6%, ERPEquity Risk Premium (ERP) = Total Yield - Risk Free Rate, Reflects the premium above risk free assets offered by the investment. is 5.3%, FCF Yield is 9.9% |
| Stock buyback supportStock Buyback 3Y Total is 1.0 Bil |
| Low stock price volatilityVol 12M is 37% |
| Megatrend and thematic driversMegatrends include Sustainable & Green Buildings, and Smart Buildings & Proptech. Themes include Energy Efficient Building Materials, IoT for Buildings, Show more. |
| Trading close to highsDist 52W High is 0.0%, Dist 3Y High is -3.1% |
| Weak revenue growthRev Chg LTMRevenue Change % Last Twelve Months (LTM) is -9.0%, Rev Chg 3Y AvgRevenue Change % averaged over trailing 3 years is -1.9%, Rev Chg QQuarterly Revenue Change % is -27% |
| Key risksTMHC key risks include [1] a significant slowdown in its order backlog and [2] persistently high cancellation rates, Show more. |
Qualitative Assessment
AI Analysis | Feedback
Taylor Morrison Home (TMHC) stock has gained about 25% since 3/31/2026 because of the following key factors:
1. Acquisition by Berkshire Hathaway. The primary catalyst for the stock's significant gain was the definitive agreement announced on June 1, 2026, for Berkshire Hathaway to acquire Taylor Morrison Home Corporation for $72.50 per share in cash. This represented a substantial 24% premium over Taylor Morrison's closing price of $58.50 on May 29, 2026, valuing the company's equity at approximately $6.8 billion and implying an enterprise value near $8.5 billion.
2. Strong Fiscal Q1 2026 Earnings Beat and Reaffirmed Full-Year Guidance. Prior to the acquisition announcement, Taylor Morrison reported robust adjusted earnings for fiscal Q1 2026 (ended March 31, 2026) on April 22, 2026. The company posted adjusted earnings of $1.12 per diluted share, significantly exceeding the analysts' consensus estimate of $0.82 by $0.30, a 36.6% beat. Additionally, quarterly revenue of $1.39 billion surpassed analyst expectations of $1.33 billion. The company also reaffirmed its full-year 2026 guidance, projecting approximately 11,000 home closings and an average closing price between $580,000 and $590,000, which instilled confidence in its operational outlook.
Show more
Taylor Morrison Home (TMHC) stock has gained about 25% since 3/31/2026 because of the following key factors:
1. Acquisition by Berkshire Hathaway. The primary catalyst for the stock's significant gain was the definitive agreement announced on June 1, 2026, for Berkshire Hathaway to acquire Taylor Morrison Home Corporation for $72.50 per share in cash. This represented a substantial 24% premium over Taylor Morrison's closing price of $58.50 on May 29, 2026, valuing the company's equity at approximately $6.8 billion and implying an enterprise value near $8.5 billion.
2. Strong Fiscal Q1 2026 Earnings Beat and Reaffirmed Full-Year Guidance. Prior to the acquisition announcement, Taylor Morrison reported robust adjusted earnings for fiscal Q1 2026 (ended March 31, 2026) on April 22, 2026. The company posted adjusted earnings of $1.12 per diluted share, significantly exceeding the analysts' consensus estimate of $0.82 by $0.30, a 36.6% beat. Additionally, quarterly revenue of $1.39 billion surpassed analyst expectations of $1.33 billion. The company also reaffirmed its full-year 2026 guidance, projecting approximately 11,000 home closings and an average closing price between $580,000 and $590,000, which instilled confidence in its operational outlook.
3. Strategic Share Repurchase Program. Taylor Morrison actively engaged in capital allocation strategies that benefited shareholders. In fiscal Q1 2026, the company invested $150 million in share repurchases. This followed a renewed authorization in February 2026 to buy back up to $1 billion in common stock, demonstrating a commitment to reducing the average diluted share count and enhancing shareholder value.
Show less
Stock Movement Drivers
Fundamental Drivers
The 24.4% change in TMHC stock from 3/31/2026 to 7/23/2026 was primarily driven by a 44.2% change in the company's P/E Multiple.| (LTM values as of) | 3312026 | 7232026 | Change |
|---|---|---|---|
| Stock Price ($) | 58.24 | 72.45 | 24.4% |
| Change Contribution By: | |||
| Total Revenues ($ Mil) | 8,121 | 7,613 | -6.3% |
| Net Income Margin (%) | 9.6% | 8.8% | -9.0% |
| P/E Multiple | 7.2 | 10.4 | 44.2% |
| Shares Outstanding (Mil) | 97 | 96 | 1.1% |
| Cumulative Contribution | 24.4% |
Market Drivers
3/31/2026 to 7/23/2026| Return | Correlation | |
|---|---|---|
| TMHC | 24.4% | |
| Market (SPY) | 13.5% | 20.8% |
| Sector (XLY) | -0.2% | 4.1% |
Fundamental Drivers
The 23.1% change in TMHC stock from 12/31/2025 to 7/23/2026 was primarily driven by a 53.0% change in the company's P/E Multiple.| (LTM values as of) | 12312025 | 7232026 | Change |
|---|---|---|---|
| Stock Price ($) | 58.87 | 72.45 | 23.1% |
| Change Contribution By: | |||
| Total Revenues ($ Mil) | 8,378 | 7,613 | -9.1% |
| Net Income Margin (%) | 10.2% | 8.8% | -13.6% |
| P/E Multiple | 6.8 | 10.4 | 53.0% |
| Shares Outstanding (Mil) | 98 | 96 | 2.5% |
| Cumulative Contribution | 23.1% |
Market Drivers
12/31/2025 to 7/23/2026| Return | Correlation | |
|---|---|---|
| TMHC | 23.1% | |
| Market (SPY) | 8.5% | 25.4% |
| Sector (XLY) | -8.7% | 18.9% |
Fundamental Drivers
The 18.0% change in TMHC stock from 6/30/2025 to 7/23/2026 was primarily driven by a 51.9% change in the company's P/E Multiple.| (LTM values as of) | 6302025 | 7232026 | Change |
|---|---|---|---|
| Stock Price ($) | 61.42 | 72.45 | 18.0% |
| Change Contribution By: | |||
| Total Revenues ($ Mil) | 8,364 | 7,613 | -9.0% |
| Net Income Margin (%) | 10.8% | 8.8% | -19.1% |
| P/E Multiple | 6.9 | 10.4 | 51.9% |
| Shares Outstanding (Mil) | 101 | 96 | 5.4% |
| Cumulative Contribution | 18.0% |
Market Drivers
6/30/2025 to 7/23/2026| Return | Correlation | |
|---|---|---|
| TMHC | 18.0% | |
| Market (SPY) | 20.5% | 23.9% |
| Sector (XLY) | 0.7% | 27.3% |
Fundamental Drivers
The 48.6% change in TMHC stock from 6/30/2023 to 7/23/2026 was primarily driven by a 110.3% change in the company's P/E Multiple.| (LTM values as of) | 6302023 | 7232026 | Change |
|---|---|---|---|
| Stock Price ($) | 48.77 | 72.45 | 48.6% |
| Change Contribution By: | |||
| Total Revenues ($ Mil) | 8,184 | 7,613 | -7.0% |
| Net Income Margin (%) | 13.0% | 8.8% | -32.7% |
| P/E Multiple | 5.0 | 10.4 | 110.3% |
| Shares Outstanding (Mil) | 108 | 96 | 12.9% |
| Cumulative Contribution | 48.6% |
Market Drivers
6/30/2023 to 7/23/2026| Return | Correlation | |
|---|---|---|
| TMHC | 48.6% | |
| Market (SPY) | 72.4% | 40.1% |
| Sector (XLY) | 31.0% | 43.8% |
Price Returns Compared
| 2021 | 2022 | 2023 | 2024 | 2025 | 2026 | Total [1] | |
|---|---|---|---|---|---|---|---|
| Returns | |||||||
| TMHC Return | 36% | -13% | 76% | 15% | -4% | 23% | 183% |
| Peers Return | 52% | -22% | 86% | 6% | -3% | -3% | 123% |
| S&P 500 Return | 27% | -19% | 24% | 23% | 16% | 10% | 100% |
Monthly Win Rates [3] | |||||||
| TMHC Win Rate | 75% | 33% | 58% | 58% | 33% | 71% | |
| Peers Win Rate | 75% | 40% | 63% | 62% | 43% | 51% | |
| S&P 500 Win Rate | 75% | 42% | 67% | 75% | 67% | 43% | |
Max Drawdowns [4] | |||||||
| TMHC Max Drawdown | -30% | -41% | -27% | -21% | -20% | -20% | |
| Peers Max Drawdown | -19% | -41% | -20% | -26% | -26% | -27% | |
| S&P 500 Max Drawdown | -5% | -25% | -10% | -8% | -19% | -9% | |
[1] Cumulative total returns since the beginning of 2021
[2] Peers: DHI, LEN, PHM, NVR, TOL. See TMHC Returns vs. Peers.
[3] Win Rate = % of calendar months in which monthly returns were positive
[4] Max drawdown represents maximum peak-to-trough decline within a year
[5] 2026 data is for the year up to 7/23/2026 (YTD)
How Low Can It Go
| Event | TMHC | S&P 500 |
|---|---|---|
| 2025 US Tariff Shock | ||
| % Loss | -12.9% | -18.8% |
| % Gain to Breakeven | 14.8% | 23.1% |
| Time to Breakeven | 84 days | 79 days |
| Summer-Fall 2023 Five Percent Yield Shock | ||
| % Loss | -24.6% | -9.5% |
| % Gain to Breakeven | 32.7% | 10.5% |
| Time to Breakeven | 45 days | 24 days |
| 2022 Inflation Shock & Fed Tightening | ||
| % Loss | -38.7% | -24.5% |
| % Gain to Breakeven | 63.2% | 32.4% |
| Time to Breakeven | 223 days | 427 days |
| 2020 COVID-19 Crash | ||
| % Loss | -74.6% | -33.7% |
| % Gain to Breakeven | 294.3% | 50.9% |
| Time to Breakeven | 308 days | 140 days |
| Q4 2018 Fed Policy Error / Growth Scare | ||
| % Loss | -16.9% | -19.2% |
| % Gain to Breakeven | 20.3% | 23.8% |
| Time to Breakeven | 77 days | 105 days |
| 2015-2016 China Devaluation / Global Growth Scare | ||
| % Loss | -45.3% | -12.2% |
| % Gain to Breakeven | 82.9% | 13.9% |
| Time to Breakeven | 303 days | 62 days |
In The Past
Taylor Morrison Home's stock fell -12.9% during the 2025 US Tariff Shock. Such a loss loss requires a 14.8% gain to breakeven.
Preserve Wealth
Limiting losses and compounding gains is essential to preserving wealth.
Asset Allocation
Actively managed asset allocation strategies protect wealth. Learn more.
| Event | TMHC | S&P 500 |
|---|---|---|
| Summer-Fall 2023 Five Percent Yield Shock | ||
| % Loss | -24.6% | -9.5% |
| % Gain to Breakeven | 32.7% | 10.5% |
| Time to Breakeven | 45 days | 24 days |
| 2022 Inflation Shock & Fed Tightening | ||
| % Loss | -38.7% | -24.5% |
| % Gain to Breakeven | 63.2% | 32.4% |
| Time to Breakeven | 223 days | 427 days |
| 2020 COVID-19 Crash | ||
| % Loss | -74.6% | -33.7% |
| % Gain to Breakeven | 294.3% | 50.9% |
| Time to Breakeven | 308 days | 140 days |
| 2015-2016 China Devaluation / Global Growth Scare | ||
| % Loss | -45.3% | -12.2% |
| % Gain to Breakeven | 82.9% | 13.9% |
| Time to Breakeven | 303 days | 62 days |
| 2014-2016 Oil Price Collapse | ||
| % Loss | -43.0% | -6.8% |
| % Gain to Breakeven | 75.6% | 7.3% |
| Time to Breakeven | 287 days | 15 days |
| 2013 Taper Tantrum | ||
| % Loss | -22.8% | -0.2% |
| % Gain to Breakeven | 29.5% | 0.2% |
| Time to Breakeven | 33 days | 1 days |
In The Past
Taylor Morrison Home's stock fell -12.9% during the 2025 US Tariff Shock. Such a loss loss requires a 14.8% gain to breakeven.
Preserve Wealth
Limiting losses and compounding gains is essential to preserving wealth.
Asset Allocation
Actively managed asset allocation strategies protect wealth. Learn more.
About Taylor Morrison Home (TMHC)
Taylor Morrison Home Corporation (TMHC) is a prominent public homebuilder operating across the United States. The company specializes in the design, construction, and sale of a variety of residential properties, including single-family detached homes and multi-family attached residences. Beyond individual homes, Taylor Morrison also develops comprehensive lifestyle and master-planned communities.
In addition to its core homebuilding operations, TMHC expands its offerings to include multi-use properties, developing commercial, retail, and multi-family units under its Urban Form brand. The company further provides ancillary services essential to the homebuying process, such as title insurance, closing settlement services, and financial services, integrating various aspects of real estate transactions for its customers.
Taylor Morrison Home serves a broad customer base across diverse geographic markets. Operating under multiple brand names including Taylor Morrison, William Lyon Signature, and Darling Homes, the company has a significant presence in key states such as Arizona, California, Colorado, Florida, Georgia, Nevada, North and South Carolina, Oregon, Texas, and Washington. This extensive reach allows TMHC to cater to various housing demands across different regional markets in the U.S.
AI Analysis | Feedback
Taylor Morrison Home is like General Motors for housing, building and selling homes under various brand names across multiple states, similar to how GM builds different car brands.
Think of Taylor Morrison Home as the Marriott of residential communities, developing a range of branded living environments, from single-family homes to master-planned neighborhoods, across various locations.
AI Analysis | Feedback
- Homebuilding: Designs, builds, and sells single and multi-family detached and attached homes.
- Community Development: Develops lifestyle and master-planned communities.
- Multi-use Property Development: Develops and constructs multi-use properties that include commercial, retail, and multi-family spaces under the Urban Form brand.
- Title Insurance and Closing Settlement Services: Offers services related to title insurance and closing settlement for real estate transactions.
- Financial Services: Provides financial services, typically to facilitate home purchases.
AI Analysis | Feedback
Taylor Morrison Home (TMHC) primarily sells homes directly to individual consumers rather than other companies. The company serves a diverse range of homebuyers, which can be categorized as follows:
- First-time Homebuyers: Individuals or families purchasing their initial home, often seeking value-oriented or entry-level properties.
- Move-up Buyers: Existing homeowners looking to purchase a larger, newer, or more feature-rich home, often in planned communities with improved amenities, as their needs or financial capacity grow.
- Active Adult/Lifestyle Buyers: Individuals, often empty nesters or retirees, who are seeking homes in communities that emphasize specific lifestyles, amenities, and lower-maintenance living, often found within the master-planned and lifestyle communities developed by Taylor Morrison.
AI Analysis | Feedback
AI Analysis | Feedback
Ms. Palmer has over 35 years of cross-functional building experience. She has led Taylor Morrison since 2007, guiding the company through its IPO in 2013 and elevating it to the top ranks of America's largest public homebuilders. Prior to joining Taylor Morrison, she served as Nevada Area President for Pulte and Del Webb, and as a division president at Blackhawk Corporation for ten years. She has served as a member of the board of directors for Offerpad Solutions Inc. and Interface, Inc. She currently serves as Chairman of the Building Talent Foundation.
Curt VanHyfte EVP, Chief Financial Officer
Mr. VanHyfte was appointed Chief Financial Officer in July 2023. He joined Taylor Morrison in February 2020 following the acquisition of William Lyon Homes. Before becoming CFO, he served as the Company's West Area President, overseeing operational excellence and growth in Western markets. He has nearly 30 years of experience in homebuilding, including division, regional, and national finance roles, and previously served as a Division President for several homebuilders in Chicago, St. Louis, Houston, and Phoenix.
Erik Heuser EVP, Chief Corporate Operations Officer
Mr. Heuser joined Taylor Morrison in 2004 as Director of Business Development. He is responsible for strategic direction, business development initiatives, and portfolio management, including chairing Taylor Morrison's Investment Committee. He also oversees the Company's Build-to-Rent business, strategic market intelligence and research, brand marketing and communications, and customer experience efforts. Before Taylor Morrison, he managed a division for Hanley Wood Market Intelligence, owned a homebuilding entity in Chicago, and held senior acquisition, institutional finance, and investment positions with PNC Mortgage, MetLife, and A.G. Edwards & Sons.
Tawn Kelley EVP, President of Financial Services
Ms. Kelley serves as the President of Financial Services for Taylor Morrison.
Darrell Sherman EVP, Chief Legal Officer
Mr. Sherman is the Chief Legal Officer and Executive Vice President for Taylor Morrison.
AI Analysis | Feedback
- Economic and Housing Market Volatility, including High Interest Rates and Affordability: Taylor Morrison Home's performance is highly dependent on overall economic conditions, including employment rates, consumer confidence, and particularly, mortgage interest rates. Sustained high mortgage rates in the mid-6% range can significantly sideline potential first-time and move-up homebuyers, making monthly payments drastically higher and impacting affordability. This often forces the company to offer increased incentives to stimulate demand, which directly pressures home closings gross margins.
- Reduced Order Backlog and Elevated Speculative Inventory: A sharp decline in the company's order backlog significantly reduces revenue visibility and indicates weaker demand conditions. This lower backlog poses a risk of a potential "air pocket" in future performance, suggesting a possible drop in home orders and closings. Additionally, an elevated level of speculative inventory (homes started without a buyer) puts further pressure on margins, as the company often needs to provide greater incentives to sell these homes, thereby reducing the net selling price.
- Intense Competition: Taylor Morrison Home operates in a highly competitive environment, facing competition from both national and regional homebuilders, as well as the resale housing market and rental housing alternatives. Competitors with potentially longer-standing relationships or greater financial resources may have an advantage in acquiring land, securing materials, or offering more attractive financing options, which can impact Taylor Morrison's ability to secure land, control costs, and maintain market share.
AI Analysis | Feedback
Advanced Modular and Prefabricated Home Construction
AI Analysis | Feedback
Taylor Morrison Home Corporation (TMHC) operates in several addressable markets within the United States.
U.S. Housing Market (Single and Multi-family Homes)
The U.S. home construction market, which includes single and multi-family homes, is a significant addressable market for Taylor Morrison. This market is expected to reach approximately $1.27 trillion in 2024. The total value of the U.S. housing market reached $49.7 trillion in 2024. For new construction, single-family housing starts are projected at a seasonally adjusted annual rate of 980,000 for November 2024, with new home sales projected at 730,000 for the same period.
U.S. Master-Planned Communities
Taylor Morrison also develops lifestyle and master-planned communities. In 2025, sales within the top 50 U.S. master-planned communities totaled 34,203 units. For example, The Villages in Florida, a prominent master-planned community, projected 3,400 sales in 2025.
U.S. Multi-Use Properties (Commercial, Retail, and Multi-family under Urban Form)
For its Urban Form brand, focusing on commercial space, retail, and multi-family properties, the addressable market can be considered within the broader commercial construction and real estate sectors. The U.S. commercial construction market is estimated at USD 567.05 billion in 2026 and is projected to grow to USD 723.25 billion by 2031. The overall U.S. commercial real estate market was valued at USD 742.3 billion in 2025.
U.S. Title Insurance and Closing Settlement Services
Taylor Morrison provides title insurance and closing settlement services. The U.S. title insurance industry conducted over $16.5 billion in business in 2023. Industry revenue is projected to increase to approximately $17.1 billion in 2025.
U.S. Financial Services
The company also offers financial services, likely related to mortgage and home financing. The total single-family mortgage origination volume in the U.S. is expected to reach $2.0 trillion in 2025 and is projected to increase to $2.2 trillion in 2026.
AI Analysis | Feedback
Expected Drivers of Future Revenue Growth for Taylor Morrison Home (TMHC)
Over the next 2-3 years, Taylor Morrison Home (TMHC) anticipates several key drivers to contribute to its future revenue growth:
- Expansion of Community Count: Taylor Morrison plans to open over 100 new community outlets in 2026, including more than 20 new Esplanade outlets, with an expectation to grow its total community count to 365-370 by year-end 2026. This expansion provides a direct path to increased home sales and revenue.
- Strategic Focus on Move-Up and Resort Lifestyle Customer Segments: The company is intentionally shifting its land investment towards core markets and higher-margin move-up and resort lifestyle buyers. Management has cited resilient demand in these communities, particularly the Esplanade brand, as a driver for future growth.
- Rebound in To-Be-Built Home Sales: Taylor Morrison's future outlook is shaped by an expected rebound in sales of homes built to order. This strategy aims to replenish the company's backlog, which was noted as lower than normal at the end of 2025, and secure future closings.
- Disciplined Land Acquisition and Management: The company's land strategy emphasizes efficiently enhancing its scale in prime submarkets and increasing its share of controlled lots. This disciplined approach to land acquisition provides flexibility and ensures a robust pipeline for developing future communities, thereby supporting long-term revenue growth.
AI Analysis | Feedback
Share Repurchases
- Taylor Morrison repurchased 6.5 million shares for $381 million in 2025.
- Since 2021, the company has repurchased approximately 39 million shares for $1.5 billion, representing about 34% of its shares outstanding.
- The Board of Directors increased the stock repurchase authorization to $1 billion through December 31, 2027, replacing a previous $500 million authorization.
Inbound Investments
- The Yardley build-to-rent platform, a part of the company's multi-use property development, is supported by a $3 billion land bank with Kennedy Lewis.
Capital Expenditures
- Taylor Morrison's homebuilding land investment totaled approximately $2.2 billion in 2025, down slightly from $2.4 billion in 2024.
- For 2023, homebuilding land investment was approximately $1.8 billion.
- Expected capital expenditures for 2026 include an investment of around $2 billion in homebuilding land, with an emphasis on move-up and resort lifestyle positions and enhancing scale in prime submarkets.
Latest Trefis Analyses
| Title | |
|---|---|
| ARTICLES |
Research & Analysis
Invest in Strategies
Wealth Management
Peer Comparisons
| Peers to compare with: |
Financials
| Median | |
|---|---|
| Name | |
| Mkt Price | 133.40 |
| Mkt Cap | 18.6 |
| Rev LTM | 13,726 |
| Op Inc LTM | 1,944 |
| FCF LTM | 1,223 |
| FCF 3Y Avg | 1,345 |
| CFO LTM | 1,283 |
| CFO 3Y Avg | 1,415 |
Growth & Margins
| Median | |
|---|---|
| Name | |
| Rev Chg LTM | -7.3% |
| Rev Chg 3Y Avg | -0.8% |
| Rev Chg Q | -11.4% |
| QoQ Delta Rev Chg LTM | -2.7% |
| Op Inc Chg LTM | -21.6% |
| Op Inc Chg 3Y Avg | -10.1% |
| Op Mgn LTM | 13.8% |
| Op Mgn 3Y Avg | 15.5% |
| QoQ Delta Op Mgn LTM | -0.7% |
| CFO/Rev LTM | 10.0% |
| CFO/Rev 3Y Avg | 8.5% |
| FCF/Rev LTM | 9.4% |
| FCF/Rev 3Y Avg | 7.9% |
Valuation
| Median | |
|---|---|
| Name | |
| Mkt Cap | 18.6 |
| P/S | 1.2 |
| P/Op Inc | 9.0 |
| P/EBIT | 9.2 |
| P/E | 11.8 |
| P/CFO | 12.8 |
| Total Yield | 9.2% |
| Dividend Yield | 0.7% |
| FCF Yield 3Y Avg | 6.1% |
| D/E | 0.2 |
| Net D/E | 0.1 |
Returns
| Median | |
|---|---|
| Name | |
| 1M Rtn | -3.2% |
| 3M Rtn | -6.0% |
| 6M Rtn | -5.1% |
| 12M Rtn | 1.2% |
| 3Y Rtn | 29.7% |
| 1M Excs Rtn | - |
| 3M Excs Rtn | - |
| 6M Excs Rtn | - |
| 12M Excs Rtn | - |
| 3Y Excs Rtn | - |
Comparison Analyses
Segment Financials
Revenue by Segment| $ Mil | 2025 | 2024 | 2023 | 2022 | 2021 |
|---|---|---|---|---|---|
| West | 3,172 | 2,987 | 3,229 | 3,127 | |
| East | 2,839 | 2,880 | 2,740 | 2,424 | |
| Central | 1,804 | 1,994 | 2,025 | 1,742 | |
| Financial Services | 209 | 199 | 135 | 165 | |
| Corporate and unallocated | 96 | 108 | 96 | 44 | |
| Amenity and other revenue | 38 | ||||
| Home closings revenue, net | 7,159 | ||||
| Land closings revenue | 61 | ||||
| Mortgage services revenue | 120 | ||||
| Title services and other revenues | 40 | ||||
| Total | 8,121 | 8,168 | 7,418 | 8,225 | 7,501 |
| $ Mil | 2025 | 2024 | 2022 | 2021 | 2020 |
|---|---|---|---|---|---|
| West | 3,510 | 3,553 | 3,147 | 3,333 | 3,212 |
| East | 2,795 | 2,650 | 2,084 | 1,978 | 1,883 |
| Central | 1,657 | 1,687 | 1,716 | 1,592 | 1,428 |
| Corporate and unallocated | 1,644 | 1,106 | 1,087 | 1,262 | 926 |
| Financial Services | 233 | 303 | 437 | 564 | 289 |
| Total | 9,838 | 9,297 | 8,471 | 8,728 | 7,738 |
Price Behavior
| Market Price | $72.45 | |
| Market Cap ($ Bil) | 7.0 | |
| First Trading Date | 04/10/2013 | |
| Distance from 52W High | -0.0% | |
| 50 Days | 200 Days | |
| DMA Price | $67.84 | $63.02 |
| DMA Trend | indeterminate | up |
| Distance from DMA | 6.8% | 15.0% |
| 3M | 1YR | |
| Volatility | 49.0% | 36.9% |
| Downside Capture | 61.09 | 68.65 |
| Upside Capture | 103.87 | 69.62 |
| Correlation (SPY) | 12.7% | 23.7% |
| 1M | 2M | 3M | 6M | 1Y | 3Y | |
|---|---|---|---|---|---|---|
| Beta | 0.34 | 0.59 | 0.81 | 0.82 | 0.75 | 0.92 |
| Up Beta | -2.49 | -0.81 | 0.81 | 0.88 | 1.00 | 0.94 |
| Down Beta | 0.09 | 0.23 | 0.04 | 0.57 | 0.35 | 0.56 |
| Up Capture | 260% | 160% | 115% | 100% | 73% | 119% |
| Bmk +ve Days | 11 | 24 | 40 | 67 | 140 | 429 |
| Stock +ve Days | 10 | 20 | 31 | 56 | 113 | 371 |
| Down Capture | -1% | 67% | 87% | 75% | 86% | 104% |
| Bmk -ve Days | 10 | 17 | 23 | 58 | 112 | 321 |
| Stock -ve Days | 11 | 21 | 32 | 69 | 137 | 377 |
[1] Upside and downside betas calculated using positive and negative benchmark daily returns respectively
Based On 1-Year Data
| Annualized Return | Annualized Volatility | Sharpe Ratio | Correlation with TMHC | |
|---|---|---|---|---|
| TMHC | 8.5% | 37.0% | 0.28 | - |
| Sector ETF (XLY) | -3.0% | 19.3% | -0.28 | 25.7% |
| Equity (SPY) | 18.5% | 12.7% | 1.06 | 23.5% |
| Gold (GLD) | 17.6% | 28.1% | 0.57 | 7.4% |
| Commodities (DBC) | 35.2% | 19.1% | 1.45 | -13.8% |
| Real Estate (VNQ) | 11.6% | 13.9% | 0.55 | 26.6% |
| Bitcoin (BTCUSD) | -45.1% | 42.9% | -1.28 | 4.0% |
Smart multi-asset allocation framework can stack odds in your favor. Learn How
Based On 5-Year Data
| Annualized Return | Annualized Volatility | Sharpe Ratio | Correlation with TMHC | |
|---|---|---|---|---|
| TMHC | 26.0% | 37.5% | 0.71 | - |
| Sector ETF (XLY) | 4.7% | 24.0% | 0.16 | 54.2% |
| Equity (SPY) | 12.6% | 17.1% | 0.57 | 53.0% |
| Gold (GLD) | 16.8% | 18.4% | 0.74 | 8.5% |
| Commodities (DBC) | 9.8% | 19.5% | 0.39 | 5.8% |
| Real Estate (VNQ) | 2.6% | 18.9% | 0.03 | 55.0% |
| Bitcoin (BTCUSD) | 15.8% | 53.4% | 0.47 | 22.2% |
Smart multi-asset allocation framework can stack odds in your favor. Learn How
Based On 10-Year Data
| Annualized Return | Annualized Volatility | Sharpe Ratio | Correlation with TMHC | |
|---|---|---|---|---|
| TMHC | 16.6% | 44.6% | 0.51 | - |
| Sector ETF (XLY) | 11.5% | 22.1% | 0.48 | 57.3% |
| Equity (SPY) | 14.9% | 17.9% | 0.71 | 56.2% |
| Gold (GLD) | 11.2% | 16.1% | 0.57 | 9.8% |
| Commodities (DBC) | 7.4% | 17.9% | 0.33 | 18.4% |
| Real Estate (VNQ) | 4.9% | 20.7% | 0.20 | 58.2% |
| Bitcoin (BTCUSD) | 58.7% | 66.2% | 0.99 | 16.8% |
Smart multi-asset allocation framework can stack odds in your favor. Learn How
Earnings Returns History
Updated 7/22/2026| Forward Returns | |||
|---|---|---|---|
| Earnings Date | 1D Returns | 5D Returns | 21D Returns |
| 4/22/2026 | 4.9% | 1.5% | -7.2% |
| 2/11/2026 | -1.1% | 1.5% | -11.4% |
| 10/22/2025 | -3.2% | -4.4% | -7.3% |
| 7/23/2025 | -3.8% | -8.8% | -0.2% |
| 4/23/2025 | -2.0% | -3.2% | -2.7% |
| 2/12/2025 | 3.3% | -0.8% | -6.9% |
| 10/23/2024 | 3.6% | 7.6% | 6.9% |
| 7/24/2024 | -0.5% | 3.3% | -1.6% |
| ... | |||
| SUMMARY STATS | |||
| # Positive | 10 | 13 | 11 |
| # Negative | 14 | 11 | 13 |
| Median Positive | 4.3% | 2.0% | 7.0% |
| Median Negative | -2.9% | -3.2% | -2.7% |
| Max Positive | 9.6% | 12.2% | 19.2% |
| Max Negative | -4.9% | -8.8% | -11.4% |
| Forward Returns | |||
|---|---|---|---|
| Earnings Date | 1D Returns | 5D Returns | 21D Returns |
| 4/22/2026 | 4.9% | 1.5% | -7.2% |
| 2/11/2026 | -1.1% | 1.5% | -11.4% |
| 10/22/2025 | -3.2% | -4.4% | -7.3% |
| 7/23/2025 | -3.8% | -8.8% | -0.2% |
| 4/23/2025 | -2.0% | -3.2% | -2.7% |
| 2/12/2025 | 3.3% | -0.8% | -6.9% |
| 10/23/2024 | 3.6% | 7.6% | 6.9% |
| 7/24/2024 | -0.5% | 3.3% | -1.6% |
| 4/30/2024 | -2.9% | 1.6% | -2.6% |
| 2/14/2024 | 5.6% | 4.7% | 7.0% |
| 10/25/2023 | -3.2% | -2.0% | 15.0% |
| 7/26/2023 | -4.6% | -1.3% | -7.8% |
| 4/26/2023 | -2.7% | 4.4% | 6.7% |
| 2/15/2023 | 1.8% | -2.8% | 0.6% |
| 10/26/2022 | -2.2% | -1.3% | 8.8% |
| 7/27/2022 | 5.5% | 2.0% | -0.4% |
| 4/27/2022 | -4.9% | 1.4% | 0.9% |
| 2/8/2022 | 0.8% | 1.5% | 5.5% |
| 10/27/2021 | 9.6% | 12.2% | 19.2% |
| 7/29/2021 | 6.9% | 5.0% | 10.6% |
| 4/29/2021 | -2.8% | -5.5% | -10.0% |
| 2/10/2021 | -3.0% | -7.3% | -1.8% |
| 10/28/2020 | 1.4% | 0.2% | 12.0% |
| 7/30/2020 | -3.4% | -4.8% | -1.8% |
| SUMMARY STATS | |||
| # Positive | 10 | 13 | 11 |
| # Negative | 14 | 11 | 13 |
| Median Positive | 4.3% | 2.0% | 7.0% |
| Median Negative | -2.9% | -3.2% | -2.7% |
| Max Positive | 9.6% | 12.2% | 19.2% |
| Max Negative | -4.9% | -8.8% | -11.4% |
SEC Filings
Expand for More| Report Date | Filing Date | Filing |
|---|---|---|
| 03/31/2026 | 04/22/2026 | 10-Q |
| 12/31/2025 | 02/18/2026 | 10-K |
| 09/30/2025 | 10/22/2025 | 10-Q |
| 06/30/2025 | 07/23/2025 | 10-Q |
| 03/31/2025 | 04/23/2025 | 10-Q |
| 12/31/2024 | 02/19/2025 | 10-K |
| 09/30/2024 | 10/24/2024 | 10-Q |
| 06/30/2024 | 07/24/2024 | 10-Q |
| 03/31/2024 | 04/30/2024 | 10-Q |
| 12/31/2023 | 02/21/2024 | 10-K |
| 09/30/2023 | 10/25/2023 | 10-Q |
| 06/30/2023 | 07/26/2023 | 10-Q |
| 03/31/2023 | 04/26/2023 | 10-Q |
| 12/31/2022 | 02/22/2023 | 10-K |
| 09/30/2022 | 10/26/2022 | 10-Q |
| 06/30/2022 | 07/28/2022 | 10-Q |
| Report Date | Filing Date | Filing |
|---|---|---|
| 03/31/2026 | 04/22/2026 | 10-Q |
| 12/31/2025 | 02/18/2026 | 10-K |
| 09/30/2025 | 10/22/2025 | 10-Q |
| 06/30/2025 | 07/23/2025 | 10-Q |
| 03/31/2025 | 04/23/2025 | 10-Q |
| 12/31/2024 | 02/19/2025 | 10-K |
| 09/30/2024 | 10/24/2024 | 10-Q |
| 06/30/2024 | 07/24/2024 | 10-Q |
| 03/31/2024 | 04/30/2024 | 10-Q |
| 12/31/2023 | 02/21/2024 | 10-K |
| 09/30/2023 | 10/25/2023 | 10-Q |
| 06/30/2023 | 07/26/2023 | 10-Q |
| 03/31/2023 | 04/26/2023 | 10-Q |
| 12/31/2022 | 02/22/2023 | 10-K |
| 09/30/2022 | 10/26/2022 | 10-Q |
| 06/30/2022 | 07/28/2022 | 10-Q |
| 03/31/2022 | 04/27/2022 | 10-Q |
| 12/31/2021 | 02/23/2022 | 10-K |
| 09/30/2021 | 10/27/2021 | 10-Q |
| 06/30/2021 | 07/29/2021 | 10-Q |
| 03/31/2021 | 04/29/2021 | 10-Q |
| 12/31/2020 | 02/24/2021 | 10-K |
| 09/30/2020 | 11/02/2020 | 10-Q |
| 06/30/2020 | 08/06/2020 | 10-Q |
| 03/31/2020 | 05/11/2020 | 10-Q |
| 12/31/2019 | 02/19/2020 | 10-K |
| 09/30/2019 | 10/30/2019 | 10-Q |
| 06/30/2019 | 08/01/2019 | 10-Q |
Recent Forward Guidance
Updated 7/12/2026Latest: Q1 2026 Earnings Reported 4/22/2026
| Forward Guidance | Guidance Change | ||||||
|---|---|---|---|---|---|---|---|
| Metric | Low | Mid | High | % Chg | % Delta | Change | Prior |
| Q2 2026 Ending Community Count | 370 | 2.8% | Raised | Guidance: 360 for Q1 2026 | |||
| 2026 Ending Community Count | 365 | 368 | 370 | 0 | Affirmed | Guidance: 368 for 2026 | |
| Q2 2026 Home Closings | 2,500 | 2,550 | 2,600 | 15.9% | Raised | Guidance: 2,200 for Q1 2026 | |
| 2026 Home Closings | 11,000 | 0 | Affirmed | Guidance: 11,000 for 2026 | |||
| Q2 2026 Average Closing Price | 0.57 Mil | -0.9% | Lowered | Guidance: 0.58 Mil for Q1 2026 | |||
| 2026 Average Closing Price | 0.58 Mil | 0.58 Mil | 0.59 Mil | 0 | Affirmed | Guidance: 0.58 Mil for 2026 | |
| Q2 2026 Home Closings Gross Margin | 20.0% | 0 | Affirmed | Guidance: 20.0% for Q1 2026 | |||
| 2026 SG&A as a Percentage of Home Closings Revenue | 0.15 | 0 | Affirmed | Guidance: 0.15 for 2026 | |||
| Q2 2026 Effective Tax Rate | 25.5% | 2.2% | Raised | Guidance: 23.25% for Q1 2026 | |||
| 2026 Effective Tax Rate | 25.0% | 0 | Affirmed | Guidance: 25.0% for 2026 | |||
| Q2 2026 Average Diluted Share Count | 95.00 Mil | -3.1% | Lowered | Guidance: 98.00 Mil for Q1 2026 | |||
| 2026 Average Diluted Share Count | 95.00 Mil | 0 | Affirmed | Guidance: 95.00 Mil for 2026 | |||
| 2026 Capital Expenditures | 2.00 Bil | 0 | Affirmed | Guidance: 2.00 Bil for 2026 | |||
| 2026 Share Repurchases | 400.00 Mil | 0 | Affirmed | Guidance: 400.00 Mil for 2026 | |||
Prior: Q3 2025 Earnings Reported 10/22/2025
| Forward Guidance | Guidance Change | ||||||
|---|---|---|---|---|---|---|---|
| Metric | Low | Mid | High | % Chg | % Delta | Change | Prior |
| Q4 2025 Ending active community count | 345 | 0.7% | Higher New | Guidance: 342 for Q3 2025 | |||
| Q4 2025 Home closings | 3,100 | 3,200 | 3,300 | -1.5% | Lower New | Guidance: 3,250 for Q3 2025 | |
| Q4 2025 Average closing price | 0.59 Mil | -1.7% | Lower New | Guidance: 0.60 Mil for Q3 2025 | |||
| Q4 2025 GAAP home closings gross margin | 21.5% | -0.5% | Lower New | Guidance: 22.0% for Q3 2025 | |||
| Q4 2025 Effective tax rate | 25.0% | 0 | Same New | Guidance: 25.0% for Q3 2025 | |||
| Q4 2025 Diluted share count | 99.00 Mil | -1.0% | Lower New | Guidance: 100.00 Mil for Q3 2025 | |||
| 2025 Home closings | 12,800 | 12,900 | 13,000 | -2.6% | Lowered | Guidance: 13,250 for 2025 | |
| 2025 Average closing price | 0.59 Mil | -0.4% | Lowered | Guidance: 0.60 Mil for 2025 | |||
| 2025 GAAP home closings gross margin | 22.5% | 0 | Affirmed | Guidance: 22.5% for 2025 | |||
| 2025 Adjusted home closings gross margin | 23.0% | 0 | Affirmed | Guidance: 23.0% for 2025 | |||
| 2025 Ending active community count | 345 | -1.4% | Lowered | Guidance: 350 for 2025 | |||
| 2025 Effective tax rate | 24.5% | 24.75% | 25.0% | 0 | Affirmed | Guidance: 24.75% for 2025 | |
| 2025 Diluted share count | 101.00 Mil | 0 | Affirmed | Guidance: 101.00 Mil for 2025 | |||
| 2025 Homebuilding land acquisition and development investment | 2.30 Bil | -4.2% | Lowered | Guidance: 2.40 Bil for 2025 | |||
| 2025 Share repurchases | 350.00 Mil | 0 | Affirmed | Guidance: 350.00 Mil for 2025 | |||
Insider Activity
Updated 7/1/2026| # | Owner | Title | Holding | Action | Filing Date | Price | Shares | Transacted Value | Value of Held Shares | Form |
|---|---|---|---|---|---|---|---|---|---|---|
| 1 | Warren, Denise | Direct | Sell | 2182026 | 69.20 | 3,075 | Form | |||
| 2 | Merrill, Stevin Todd | EVP, CLO & Secretary | Direct | Sell | 9152025 | 70.04 | 4,412 | Form | ||
| 3 | Mariucci, Anne L | Direct | Sell | 9152025 | 70.00 | 14,002 | 980,140 | 3,373,370 | Form | |
| 4 | Palmer, Sheryl | Chairman, President and CEO | Direct | Sell | 9082025 | 72.06 | 13,513 | 973,747 | 26,696,428 | Form |
| 5 | Palmer, Sheryl | Chairman, President and CEO | Direct | Sell | 8262025 | 70.20 | 25,000 | 1,755,000 | 26,955,958 | Form |
| # | Owner | Title | Holding | Action | Filing Date | Price | Shares | Transacted Value | Value of Held Shares | Form |
|---|---|---|---|---|---|---|---|---|---|---|
| 1 | Warren, Denise | Direct | Sell | 2182026 | 69.20 | 3,075 | Form | |||
| 2 | Merrill, Stevin Todd | EVP, CLO & Secretary | Direct | Sell | 9152025 | 70.04 | 4,412 | Form | ||
| 3 | Mariucci, Anne L | Direct | Sell | 9152025 | 70.00 | 14,002 | 980,140 | 3,373,370 | Form | |
| 4 | Palmer, Sheryl | Chairman, President and CEO | Direct | Sell | 9082025 | 72.06 | 13,513 | 973,747 | 26,696,428 | Form |
| 5 | Palmer, Sheryl | Chairman, President and CEO | Direct | Sell | 8262025 | 70.20 | 25,000 | 1,755,000 | 26,955,958 | Form |
| 6 | Vanhyfte, Curtis | CFO | Direct | Sell | 8262025 | 69.97 | 5,082 | 355,588 | 821,588 | Form |
| 7 | Vanhyfte, Curtis | CFO | Direct | Sell | 8222025 | 68.67 | 3,501 | 240,414 | 806,323 | Form |
| 8 | Vanhyfte, Curtis | CFO | Direct | Sell | 8082025 | 65.22 | 9,754 | 636,156 | 923,711 | Form |
Investor Activity (13F)
Updated Jul 24, 2026Active managers (13F portfolio over $250M, at least 3 holdings) with a position over $5M that is either over 10% of their portfolio or held in a concentrated book of 50 or fewer total positions. Index/ETF, sovereign, bank, community-bank and charitable/donor-advised filers are excluded.
| Active Manager |
|---|
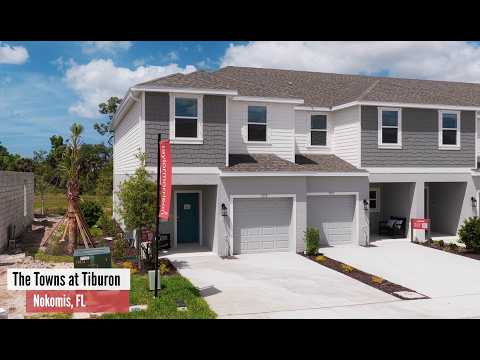
Taylor Morrison Home — Investor Video Playlist




Industry Resources
| Consumer Discretionary Resources |
| Retail Dive |
| Business of Fashion (BoF) |
| WWD (Women's Wear Daily) |
| National Retail Federation (NRF) |
| McKinsey & Company - Consumer |
| Mintel Consumer Trends |
| Homebuilding Resources |
| Builder Online |
| Professional Builder |
| HousingWire |
External Quote Links
| Y Finance | Barrons |
| TradingView | Morningstar |
| SeekingAlpha | ValueLine |
| Motley Fool | Robinhood |
| CNBC | Etrade |
| MarketWatch | Unusual Whales |
| YCharts | Perplexity Finance |
| FinViz |
Prefer one of these to Trefis? Tell us why.