
Once Upon a Farm PBC (OFRM)
Market Price (11/2/2026): $9.51 | Market Cap: $399.3 MilSector: Consumer Staples | Industry: Packaged Foods & Meats
Once Upon a Farm PBC (OFRM)
Market Price (11/2/2026): $9.51Market Cap: $399.3 MilSector: Consumer StaplesIndustry: Packaged Foods & Meats
Investment Highlights Why It Matters Detailed financial logic regarding cash flow yields vs trend-riding momentum.
Cash is significant % of market capNet D/ENet Debt/Equity. Debt net of cash. Negative indicates net cash. Equity is taken as the Market Capitalization is -15% Strong revenue growthRev Chg LTMRevenue Change % Last Twelve Months (LTM) is 43% Megatrend and thematic driversMegatrends include Health & Wellness Trends, and E-commerce & DTC Adoption. Themes include Organic & Natural Products, Functional Foods & Beverages, Show more. | Weak multi-year price returns2Y Excs Rtn is -62%, 3Y Excs Rtn is -114% Meaningful short interestShort Interest % of Basic SharesShort Interest % of Basic Shares = (Short Interest Quantity) / (Basic Shares Outstanding). A high fraction of short interest can indicate potential risk of a short squeeze. is 13% | Not profitable at operating income levelOp Inc LTMOperating Income, Last Twelve Months is -18 Mil, Op Mgn LTMOperating Margin = Operating Income / Revenue Reflects profitability before taxes and before impact of capital structure (interest payments). is -6.4% Not cash flow generativeCFO/Rev LTMCash Flow from Operations / Revenue (Sales), Last Twelve Months (LTM) is -11%, FCF/Rev LTMFree Cash Flow / Revenue (Sales), Last Twelve Months (LTM) is -13% Yield minus risk free rate is negativeERPEquity Risk Premium (ERP) = Total Yield - Risk Free Rate, Reflects the premium above risk free assets offered by the investment. is -5.6% Significant short interestShort Interest Days-to-CoverDTC = (Short Interest Share Quantity) / (Average Daily Trading Volume). Reflects how many days it would take to cover (close out) the short interest based on average volumes. High DTC can signify an increased risk of a short squeeze. is 17.19 Key risksOFRM key risks include [1] sustained operating losses despite revenue growth and [2] supply chain vulnerabilities tied to its reliance on fresh, Show more. |
| Cash is significant % of market capNet D/ENet Debt/Equity. Debt net of cash. Negative indicates net cash. Equity is taken as the Market Capitalization is -15% |
| Strong revenue growthRev Chg LTMRevenue Change % Last Twelve Months (LTM) is 43% |
| Megatrend and thematic driversMegatrends include Health & Wellness Trends, and E-commerce & DTC Adoption. Themes include Organic & Natural Products, Functional Foods & Beverages, Show more. |
| Weak multi-year price returns2Y Excs Rtn is -62%, 3Y Excs Rtn is -114% |
| Meaningful short interestShort Interest % of Basic SharesShort Interest % of Basic Shares = (Short Interest Quantity) / (Basic Shares Outstanding). A high fraction of short interest can indicate potential risk of a short squeeze. is 13% |
| Not profitable at operating income levelOp Inc LTMOperating Income, Last Twelve Months is -18 Mil, Op Mgn LTMOperating Margin = Operating Income / Revenue Reflects profitability before taxes and before impact of capital structure (interest payments). is -6.4% |
| Not cash flow generativeCFO/Rev LTMCash Flow from Operations / Revenue (Sales), Last Twelve Months (LTM) is -11%, FCF/Rev LTMFree Cash Flow / Revenue (Sales), Last Twelve Months (LTM) is -13% |
| Yield minus risk free rate is negativeERPEquity Risk Premium (ERP) = Total Yield - Risk Free Rate, Reflects the premium above risk free assets offered by the investment. is -5.6% |
| Significant short interestShort Interest Days-to-CoverDTC = (Short Interest Share Quantity) / (Average Daily Trading Volume). Reflects how many days it would take to cover (close out) the short interest based on average volumes. High DTC can signify an increased risk of a short squeeze. is 17.19 |
| Key risksOFRM key risks include [1] sustained operating losses despite revenue growth and [2] supply chain vulnerabilities tied to its reliance on fresh, Show more. |
Qualitative Assessment
AI Analysis | Feedback
Once Upon a Farm PBC (OFRM) stock has remained largely at the same level since 7/31/2026 because of the following key factors:
1. Positive Fiscal Q2 2026 Performance Offset by Gross Margin Pressures.
Once Upon a Farm reported stronger-than-expected financial results for its fiscal second quarter, which ended June 30, 2026, with net sales surging 42.3% year-over-year to $85.4 million, surpassing analyst estimates. The company also raised its full-year fiscal 2026 net sales guidance to between $327 million and $335 million, and adjusted EBITDA guidance to between $3 million and $4.5 million. However, this positive revenue growth was partially counteracted by a decrease in gross margin, which fell to 35.9% from 40.8% in the prior year, primarily due to increased trade spending and higher costs.
2. Product Innovation and Market Positioning Balanced by Valuation Concerns.
The company continued its focus on product innovation and market expansion during the period, including the introduction of new organic electrolyte pouches in early fiscal Q4 2026. Once Upon a Farm maintained strong consumer appeal and repeat purchase rates within the organic kids' food category, supporting its long-term goal of 20% annual growth and plans to triple household penetration. Despite these growth drivers and a consensus "Hold" rating from analysts with an average price target of $25.72, the stock was noted as potentially overvalued relative to its fair value in August 2026, likely capping significant upward price movement.
Show more
Once Upon a Farm PBC (OFRM) stock has remained largely at the same level since 7/31/2026 because of the following key factors:
1. Positive Fiscal Q2 2026 Performance Offset by Gross Margin Pressures.
Once Upon a Farm reported stronger-than-expected financial results for its fiscal second quarter, which ended June 30, 2026, with net sales surging 42.3% year-over-year to $85.4 million, surpassing analyst estimates. The company also raised its full-year fiscal 2026 net sales guidance to between $327 million and $335 million, and adjusted EBITDA guidance to between $3 million and $4.5 million. However, this positive revenue growth was partially counteracted by a decrease in gross margin, which fell to 35.9% from 40.8% in the prior year, primarily due to increased trade spending and higher costs.
2. Product Innovation and Market Positioning Balanced by Valuation Concerns.
The company continued its focus on product innovation and market expansion during the period, including the introduction of new organic electrolyte pouches in early fiscal Q4 2026. Once Upon a Farm maintained strong consumer appeal and repeat purchase rates within the organic kids' food category, supporting its long-term goal of 20% annual growth and plans to triple household penetration. Despite these growth drivers and a consensus "Hold" rating from analysts with an average price target of $25.72, the stock was noted as potentially overvalued relative to its fair value in August 2026, likely capping significant upward price movement.
3. Significant Impact from Nationwide Product Recall.
Toward the end of the specified period, Once Upon a Farm announced a nationwide recall and reformulation of its "Tractor Wheels" soft-baked bars in late October 2026 due to a potential choking hazard for toddlers, following three consumer complaints and an FDA advisory. This product line accounted for approximately 18% of the company's year-to-date net sales. The recall introduced considerable financial headwinds, including inventory write-offs, refund costs, and potential damage to brand reputation and retail shelf allocations, contributing to downward pressure on the stock.
Show less
Stock Movement Drivers
Fundamental Drivers
The -1.0% change in OFRM stock from 7/31/2026 to 10/31/2026 was primarily driven by a -35.9% change in the company's Shares Outstanding (Mil).| (LTM values as of) | 7312026 | 10312026 | Change |
|---|---|---|---|
| Stock Price ($) | 15.17 | 15.02 | -1.0% |
| Change Contribution By: | |||
| Total Revenues ($ Mil) | 263 | 288 | 9.7% |
| P/S Multiple | 1.6 | 2.2 | 40.8% |
| Shares Outstanding (Mil) | 27 | 42 | -35.9% |
| Cumulative Contribution | -1.0% |
Market Drivers
7/31/2026 to 10/31/2026| Return | Correlation | |
|---|---|---|
| OFRM | -1.0% | |
| Market (SPY) | 1.2% | 36.1% |
| Sector (XLP) | 5.1% | 29.8% |
Fundamental Drivers
The -1.5% change in OFRM stock from 4/30/2026 to 10/31/2026 was primarily driven by a -14.3% change in the company's P/S Multiple.| (LTM values as of) | 4302026 | 10312026 | Change |
|---|---|---|---|
| Stock Price ($) | 15.25 | 15.02 | -1.5% |
| Change Contribution By: | |||
| Total Revenues ($ Mil) | 241 | 288 | 19.7% |
| P/S Multiple | 2.5 | 2.2 | -14.3% |
| Shares Outstanding (Mil) | 40 | 42 | -4.1% |
| Cumulative Contribution | -1.5% |
Market Drivers
4/30/2026 to 10/31/2026| Return | Correlation | |
|---|---|---|
| OFRM | -1.5% | |
| Market (SPY) | 5.4% | 6.7% |
| Sector (XLP) | 6.8% | 40.4% |
Fundamental Drivers
nullnull
Market Drivers
10/31/2025 to 10/31/2026| Return | Correlation | |
|---|---|---|
| OFRM | ||
| Market (SPY) | 11.7% | 19.1% |
| Sector (XLP) | 19.7% | 31.4% |
Fundamental Drivers
nullnull
Market Drivers
10/31/2023 to 10/31/2026| Return | Correlation | |
|---|---|---|
| OFRM | ||
| Market (SPY) | 86.9% | 19.1% |
| Sector (XLP) | 42.0% | 31.4% |
Price Returns Compared
| 2021 | 2022 | 2023 | 2024 | 2025 | 2026 | Total [1] | |
|---|---|---|---|---|---|---|---|
| Returns | |||||||
| OFRM Return | - | - | - | - | - | -29% | -29% |
| Peers Return | 16% | -7% | -9% | -13% | -23% | -19% | -47% |
| S&P 500 Return | 27% | -19% | 24% | 23% | 16% | 13% | 106% |
Monthly Win Rates [3] | |||||||
| OFRM Win Rate | - | - | - | - | - | 44% | |
| Peers Win Rate | 52% | 45% | 47% | 47% | 42% | 48% | |
| S&P 500 Win Rate | 75% | 42% | 67% | 75% | 67% | 50% | |
Max Drawdowns [4] | |||||||
| OFRM Max Drawdown | - | - | - | - | - | - | |
| Peers Max Drawdown | -16% | -30% | -31% | -24% | -34% | -38% | |
| S&P 500 Max Drawdown | -5% | -25% | -10% | -8% | -19% | -9% | |
[1] Cumulative total returns since the beginning of 2021
[2] Peers: HAIN, GIS, ABT, KHC, MDLZ.
[3] Win Rate = % of calendar months in which monthly returns were positive
[4] Max drawdown represents maximum peak-to-trough decline within a year
[5] 2026 data is for the year up to 10/30/2026 (YTD)
How Low Can It Go
OFRM has limited trading history. Below is the Consumer Staples sector ETF (XLP) in its place.
| Event | XLP | S&P 500 |
|---|---|---|
| Summer-Fall 2023 Five Percent Yield Shock | ||
| % Loss | -12.2% | -9.5% |
| % Gain to Breakeven | 13.8% | 10.5% |
| Time to Breakeven | 146 days | 24 days |
| 2022 Inflation Shock & Fed Tightening | ||
| % Loss | -12.1% | -24.5% |
| % Gain to Breakeven | 13.8% | 32.4% |
| Time to Breakeven | 46 days | 427 days |
| 2020 COVID-19 Crash | ||
| % Loss | -24.2% | -33.7% |
| % Gain to Breakeven | 31.9% | 50.9% |
| Time to Breakeven | 140 days | 140 days |
| 2011 US Debt Ceiling Crisis & European Contagion | ||
| % Loss | -10.7% | -17.9% |
| % Gain to Breakeven | 12.0% | 21.8% |
| Time to Breakeven | 78 days | 123 days |
| 2008-2009 Global Financial Crisis | ||
| % Loss | -31.8% | -53.4% |
| % Gain to Breakeven | 46.7% | 114.4% |
| Time to Breakeven | 371 days | 1085 days |
In The Past
State Street Consumer Staples Select Sector SPDR ETF's stock fell -5.9% during the 2025 US Tariff Shock. Such a loss loss requires a 6.2% gain to breakeven.
Preserve Wealth
Limiting losses and compounding gains is essential to preserving wealth.
Asset Allocation
Actively managed asset allocation strategies protect wealth. Learn more.
OFRM has limited trading history. Below is the Consumer Staples sector ETF (XLP) in its place.
| Event | XLP | S&P 500 |
|---|---|---|
| 2020 COVID-19 Crash | ||
| % Loss | -24.2% | -33.7% |
| % Gain to Breakeven | 31.9% | 50.9% |
| Time to Breakeven | 140 days | 140 days |
| 2008-2009 Global Financial Crisis | ||
| % Loss | -31.8% | -53.4% |
| % Gain to Breakeven | 46.7% | 114.4% |
| Time to Breakeven | 371 days | 1085 days |
In The Past
State Street Consumer Staples Select Sector SPDR ETF's stock fell -5.9% during the 2025 US Tariff Shock. Such a loss loss requires a 6.2% gain to breakeven.
Preserve Wealth
Limiting losses and compounding gains is essential to preserving wealth.
Asset Allocation
Actively managed asset allocation strategies protect wealth. Learn more.
About Once Upon a Farm PBC (OFRM)
Once Upon a Farm PBC (OFRM) is a public benefit corporation committed to transforming childhood nutrition. The company specializes in producing real, organic, farm-fresh food for babies and kids, emphasizing products with no added sugar, no preservatives, and nothing artificial. As a rapidly expanding leader in modern childhood nutrition, OFRM's mission is to provide innovative, nutrient-packed, and delicious options for on-the-go parents, while also upholding high social and environmental standards as part of its public benefit charter.
The company's core product offerings span various stages of childhood, from first bites to school-ready snacks. Key products include their pioneering cold-pressed Pouches, freshly Frozen Meals, Refrigerated Oat Bars, and Dry Baby Snacks. These thoughtfully crafted recipes utilize high-quality organic ingredients, setting a new standard for nutrition that parents trust and children enjoy, thereby eliminating the need to compromise on taste, quality, or convenience.
Once Upon a Farm primarily serves parents seeking superior, healthy food choices for their babies and kids. Its products are widely available across the U.S. in over 25,000 retail locations, including U.S. Multi-Outlet and Natural Expanded channels, as well as through e-commerce. OFRM strategically maintains an "all aisle" presence within stores, selling in both the fresh perimeter and center of store. This approach helps the company attract larger basket shoppers and drives significant incremental growth and improved margin outcomes for retailers, solidifying its position as a leading growth brand in its categories.
AI Analysis | Feedback
Chobani for baby and kids' food.
Tesla for baby food and kids' snacks.
AI Analysis | Feedback
- Cold-pressed Pouches: Nutrient-packed, cold-pressed food in a convenient pouch format, setting a new standard for childhood nutrition.
- Freshly Frozen Meals: Prepared meals that are frozen to maintain freshness and nutritional value for babies and kids.
- Refrigerated Oat Bars: Snack bars made with high-quality organic oats, designed to be kept refrigerated for freshness.
- Dry Baby Snacks: Shelf-stable snack options specifically crafted for babies, made with organic ingredients.
AI Analysis | Feedback
Once Upon a Farm PBC (OFRM) primarily sells its products to other companies, specifically a network of retailers.
The company states it has strong relationships with well-known retailers across U.S. Multi-Outlet (“MULO”) and Natural Expanded channels, including both brick-and-mortar stores and e-commerce platforms. However, the provided background information does not explicitly name these major customer companies.
AI Analysis | Feedback
AI Analysis | Feedback
John Foraker Co-Founder & CEO
John Foraker is the Co-Founder and CEO of Once Upon a Farm. He is a natural and organic food industry veteran with over 30 years of experience. Prior to Once Upon a Farm, he was the longtime leader of Annie's, Inc. from 1999 to 2017, taking the company public in 2012 before its acquisition by General Mills for $820 million in 2014. He then advised General Mills' small business incubator, 301, Inc. Once Upon a Farm itself has received funding from private equity firms, including CAVU Consumer Partners.
Lawrence Waldman President & CFO
Lawrence Waldman serves as the President and Chief Financial Officer of Once Upon a Farm. He previously held the role of COO & CFO from November 2017 to May 2022, and then President and COO from May 2022 before assuming his current position. His background includes experience as an independent Supply Chain Consultant and as a Board Member, President, and CFO/COO at ALOHA Nutrition. He has also held senior roles in supply chain, operations, and finance at companies such as Annie's Inc. and Columbus Foods.
Jennifer Garner Co-Founder & Chief Brand Officer
Jennifer Garner is a Co-Founder and Chief Brand Officer at Once Upon a Farm. An actress, philanthropist, and mother of three, she joined the company in September 2017, guiding its overall vision with a focus on brand voice, design, and activation. Her family's century-old farm in Locust Grove, Oklahoma, serves as inspiration for some of the company's recipes.
Cassandra Curtis Co-Founder & Chief Innovation Officer
Cassandra Curtis is a Co-Founder and Chief Innovation Officer for Once Upon a Farm. She co-founded the company in 2015 with Ari Raz, developing the original cold-pressed, organic baby food recipes in her own kitchen due to a lack of nutritious options available in stores for her daughter. She is responsible for leading product innovation and developing products using high-quality organic ingredients.
Ari Raz Co-Founder & President
Ari Raz is a Co-Founder and President of Once Upon a Farm. He co-founded the company in 2015 alongside Cassandra Curtis. In his role, he guides aspects of the company's business operations and helps ensure product distribution.
AI Analysis | Feedback
Key Business Risks for Once Upon a Farm PBC (OFRM)
- Maintaining Product Quality, Safety, and Consumer Trust: Once Upon a Farm’s brand identity and market success are critically tied to its commitment to providing "real, organic, farm-fresh food—made with no added sugar, no preservatives, and nothing artificial." As a public benefit corporation, the company is also required to uphold high social and environmental standards and provide transparency. Any perceived or actual failure to maintain these stringent product standards, ensure product safety, or uphold its public benefit commitments could severely damage consumer trust, brand reputation, and sales. Furthermore, the reliance on "high-quality organic ingredients" introduces risks related to the availability, cost, and consistent sourcing of these specific inputs, which could impact production and profitability.
- Competitive Landscape and Sustaining Market Leadership: Despite being a "rapidly growing leader" and the "#1 growth brand" in the categories it plays in, the childhood nutrition market is likely competitive and subject to evolving consumer preferences and innovations. Maintaining its current growth trajectory and market leadership will require continuous product development, effective marketing strategies, and the ability to adapt to competitive pressures and changing dietary trends among parents and children.
- Dependence on Retailer Relationships and Distribution Channels: Once Upon a Farm's products are sold in "more than 25,000 doors nationwide" and the company highlights "strong relationships with well-known retailers." A significant portion of its sales and market reach relies on these established distribution channels. Any disruption to these key retailer relationships, changes in retailers' merchandising or procurement strategies, or challenges in maintaining effective distribution across its multi-outlet and natural expanded channels could negatively impact product availability, sales, and overall market presence.
AI Analysis | Feedback
AI Analysis | Feedback
The addressable market for Once Upon a Farm PBC's main products and services, which include organic baby and kid food such as cold-pressed pouches, frozen meals, refrigerated oat bars, and dry baby snacks, is estimated to be approximately $79 billion in retail sales annually. This market size is specific to the U.S. region.
AI Analysis | Feedback
Expected Drivers of Future Revenue Growth for Once Upon a Farm PBC (OFRM)
- Expansion of Cooler Program and Retail Distribution: Once Upon a Farm plans to significantly expand its cooler program, targeting 5,000 units by the end of 2026. This expansion, along with increased distribution to new stores and optimizing placement within existing retailers, is expected to enhance brand visibility and drive incremental sales growth. The company currently sells through over 25,000 retail doors nationwide.
- New Product Introductions and Innovation: The company is actively launching innovative products across its baby and kids' categories. Recent introductions in early April 2026 include refrigerated, cold pressure-protected meat pouches for babies, smoothies with protein and probiotics for older children, and Power Wheels soft and chewy snack bars. These new offerings are anticipated to drive continued growth and expand the brand's presence in various aisles.
- Increased Household Penetration: Once Upon a Farm aims to significantly increase its household penetration. With a household penetration of 5.1% as of December 31, 2025, the company sees substantial opportunity to attract new consumers and grow its customer base.
- Higher Average Selling Prices (ASP): Revenue growth in Q4 2025 was partly attributed to higher average selling prices. This suggests a strategy of maintaining premium pricing for its organic, fresh products, contributing to top-line expansion.
- Continued Market Share Gains: As a rapidly growing leader and the "#1 growth brand in the category," Once Upon a Farm is positioned to continue capturing market share within the modern childhood nutrition segment. Its focus on real, organic, no-added-sugar products appeals to parents, fostering strong brand loyalty and advocacy.
AI Analysis | Feedback
Share Issuance
- Once Upon a Farm completed an initial public offering (IPO) in February 2026.
- The company issued 7.6 million primary shares of common stock, along with an additional 1.6 million shares through the underwriters' option, at a price of $18 per share.
- The net proceeds to the company from the IPO were approximately $139.3 million.
Inbound Investments
- Prior to its IPO, Once Upon a Farm raised $52 million in a funding round in 2022.
- As of June 30, 2025, the company had received $110.4 million in fair market value investments from investors including Cambridge Companies SPG, CAVU Venture Partners, and S2G Investments.
Outbound Investments
- The company's most recent acquisition was Raised Real on June 22, 2021.
Capital Expenditures
- Once Upon a Farm allocated approximately $25 million of its IPO proceeds towards purchasing new equipment for operations.
- The company reported increased investments in capital expenditures to support its growth, which contributed to a decrease in net cash as of December 31, 2025.
- A significant focus of capital expenditures is on upfront slotting fees for placing more coolers in stores and for research and development, with plans to expand its baby aisle cooler program to 5,000 units by the end of 2026.
Research & Analysis
Invest in Strategies
Wealth Management
Peer Comparisons
| Peers to compare with: |
Financials
| Median | |
|---|---|
| Name | |
| Mkt Price | 29.33 |
| Mkt Cap | 29.1 |
| Rev LTM | 24,900 |
| Op Inc LTM | 4,228 |
| FCF LTM | 3,658 |
| FCF 3Y Avg | 3,313 |
| CFO LTM | 4,621 |
| CFO 3Y Avg | 4,453 |
Growth & Margins
| Median | |
|---|---|
| Name | |
| Rev Chg LTM | 6.0% |
| Rev Chg 3Y Avg | 0.7% |
| Rev Chg Q | 2.3% |
| QoQ Delta Rev Chg LTM | 0.6% |
| Op Inc Chg LTM | -11.7% |
| Op Inc Chg 3Y Avg | 0.7% |
| Op Mgn LTM | 15.2% |
| Op Mgn 3Y Avg | 16.5% |
| QoQ Delta Op Mgn LTM | -1.3% |
| CFO/Rev LTM | 12.5% |
| CFO/Rev 3Y Avg | 15.8% |
| FCF/Rev LTM | 9.2% |
| FCF/Rev 3Y Avg | 12.3% |
Price Behavior
| Market Price | $15.02 | |
| Market Cap ($ Bil) | 0.6 | |
| First Trading Date | 02/06/2026 | |
| Distance from 52W High | -42.1% | |
| 50 Days | 200 Days | |
| DMA Price | $16.61 | |
| DMA Trend | down | |
| Distance from DMA | -9.6% | |
| 3M | 1YR | |
| Volatility | 43.4% | 61.1% |
| Downside Capture | 135.99 | |
| Upside Capture | 149.28 | |
| Correlation (S&P 500) | 21.8% |
| 1M | 2M | 3M | 6M | 1Y | 3Y | |
|---|---|---|---|---|---|---|
| Beta | 1.09 | 0.80 | 1.53 | 0.33 | -0.64 | 0.08 |
| Up Beta | -1.79 | -1.40 | 1.70 | 0.33 | -0.23 | 0.49 |
| Down Beta | 0.23 | 0.49 | 1.17 | 0.02 | -1.61 | -0.19 |
| Up Capture | 127% | 74% | 158% | 35% | 47% | 4% |
| Bmk +ve Days | 12 | 18 | 28 | 62 | 130 | 427 |
| Stock +ve Days | 12 | 20 | 36 | 66 | 92 | 92 |
| Down Capture | 174% | 168% | 159% | 55% | 109% | 63% |
| Bmk -ve Days | 10 | 25 | 36 | 64 | 121 | 325 |
| Stock -ve Days | 10 | 23 | 28 | 58 | 88 | 88 |
[1] Upside and downside betas calculated using positive and negative benchmark daily returns respectively
Based On 1-Year Data
| Annualized Return | Annualized Volatility | Sharpe Ratio | Correlation with OFRM | |
|---|---|---|---|---|
| OFRM | -28.7% | 61.1% | -0.52 | - |
| Sector ETF (XLP) | 19.3% | 15.2% | 0.94 | 31.4% |
| Equity (SPY) | 10.9% | 12.8% | 0.52 | 19.1% |
| Gold (GLD) | -2.0% | 28.6% | -0.08 | 13.2% |
| Commodities (DBC) | 48.2% | 20.6% | 1.79 | -18.0% |
| Real Estate (VNQ) | 10.2% | 13.7% | 0.45 | 29.8% |
| Bitcoin (BTCUSD) | -30.0% | 43.5% | -0.70 | 3.4% |
Smart multi-asset allocation framework can stack odds in your favor. Learn How
Based On 5-Year Data
| Annualized Return | Annualized Volatility | Sharpe Ratio | Correlation with OFRM | |
|---|---|---|---|---|
| OFRM | -6.5% | 61.1% | -0.52 | - |
| Sector ETF (XLP) | 7.3% | 13.9% | 0.30 | 31.4% |
| Equity (SPY) | 12.2% | 17.1% | 0.53 | 19.1% |
| Gold (GLD) | 16.2% | 19.0% | 0.68 | 13.2% |
| Commodities (DBC) | 9.2% | 19.5% | 0.35 | -18.0% |
| Real Estate (VNQ) | 0.9% | 18.9% | -0.06 | 29.8% |
| Bitcoin (BTCUSD) | 4.9% | 51.6% | 0.28 | 3.4% |
Smart multi-asset allocation framework can stack odds in your favor. Learn How
Based On 10-Year Data
| Annualized Return | Annualized Volatility | Sharpe Ratio | Correlation with OFRM | |
|---|---|---|---|---|
| OFRM | -3.3% | 61.1% | -0.52 | - |
| Sector ETF (XLP) | 8.4% | 15.0% | 0.42 | 31.4% |
| Equity (SPY) | 15.2% | 17.9% | 0.72 | 19.1% |
| Gold (GLD) | 11.4% | 16.5% | 0.56 | 13.2% |
| Commodities (DBC) | 8.2% | 18.1% | 0.37 | -18.0% |
| Real Estate (VNQ) | 5.3% | 20.7% | 0.21 | 29.8% |
| Bitcoin (BTCUSD) | 61.8% | 66.2% | 1.02 | 3.4% |
Smart multi-asset allocation framework can stack odds in your favor. Learn How
Insider Activity
Updated 10/21/2026| # | Owner | Title | Holding | Action | Filing Date | Price | Shares | Transacted Value | Value of Held Shares | Form |
|---|---|---|---|---|---|---|---|---|---|---|
| 1 | Folena, Chris | Chief Accounting Officer | Direct | Sell | 9162026 | 16.98 | 662 | 11,241 | 204,813 | Form |
| 2 | Waldman, Lawrence Steven | See Remarks | Direct | Sell | 9162026 | 16.98 | 1,102 | 18,712 | 1,707,747 | Form |
| 3 | Curtis, Cassandra Nicole | Chief Innovation Officer | Direct | Sell | 9162026 | 16.98 | 68 | 1,155 | 7,349,623 | Form |
| 4 | Waldman, Lawrence Steven | See Remarks | Direct | Sell | 8122026 | 18.01 | 1,206 | 21,720 | 1,831,185 | Form |
| 5 | Folena, Chris | Chief Accounting Officer | Direct | Sell | 8122026 | 18.01 | 724 | 13,039 | 229,159 | Form |
| # | Owner | Title | Holding | Action | Filing Date | Price | Shares | Transacted Value | Value of Held Shares | Form |
|---|---|---|---|---|---|---|---|---|---|---|
| 1 | Folena, Chris | Chief Accounting Officer | Direct | Sell | 9162026 | 16.98 | 662 | 11,241 | 204,813 | Form |
| 2 | Waldman, Lawrence Steven | See Remarks | Direct | Sell | 9162026 | 16.98 | 1,102 | 18,712 | 1,707,747 | Form |
| 3 | Curtis, Cassandra Nicole | Chief Innovation Officer | Direct | Sell | 9162026 | 16.98 | 68 | 1,155 | 7,349,623 | Form |
| 4 | Waldman, Lawrence Steven | See Remarks | Direct | Sell | 8122026 | 18.01 | 1,206 | 21,720 | 1,831,185 | Form |
| 5 | Folena, Chris | Chief Accounting Officer | Direct | Sell | 8122026 | 18.01 | 724 | 13,039 | 229,159 | Form |
| 6 | Curtis, Cassandra Nicole | Chief Innovation Officer | Direct | Sell | 8122026 | 18.01 | 75 | 1,351 | 7,796,673 | Form |
| 7 | Robb, Walter E IV | Direct | Buy | 2092026 | 18.00 | 5,555 | 99,990 | 2,627,460 | Form |
Investor Activity (13F)
Updated Nov 2, 2026Active managers (13F portfolio over $250M, at least 3 holdings) with a position over $5M that is either over 10% of their portfolio or held in a concentrated book of 50 or fewer total positions. Index/ETF, sovereign, bank, community-bank and charitable/donor-advised filers are excluded.
| Active Manager |
|---|
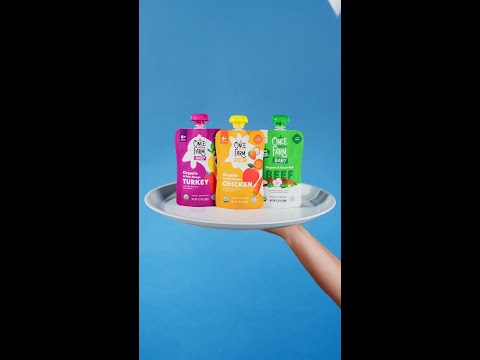
Once Upon a Farm PBC — Investor Video Playlist



Industry Resources
| Consumer Staples Resources |
| FoodNavigator |
| Consumer Goods Technology (CGT) |
| Beverage Digest |
| Packaged Foods & Meats Resources |
| USDA Data |
| Food Processing |
| Meat+Poultry |
| Just Food |
External Quote Links
| Y Finance | Barrons |
| TradingView | Morningstar |
| SeekingAlpha | ValueLine |
| Motley Fool | Robinhood |
| CNBC | Etrade |
| MarketWatch | Unusual Whales |
| YCharts | Perplexity Finance |
| FinViz |
Prefer one of these to Trefis? Tell us why.