
McDonald's (MCD)
Market Price (10/19/2026): $242.56 | Market Cap: $172.0 BilInvestor Relations Sector: Consumer Discretionary | Industry: Restaurants
McDonald's (MCD)
Market Price (10/19/2026): $242.56Market Cap: $172.0 BilSector: Consumer DiscretionaryIndustry: Restaurants
Investment Highlights Why It Matters Detailed financial logic regarding cash flow yields vs trend-riding momentum.
Attractive yieldTotal YieldTotal Yield = Earnings Yield + Dividend Yield, Earnings Yield = Net Income / Market Cap Dividend Yield = Total Dividends / Market Cap is 8.1%, Dividend Yield is 3.0%, ERPEquity Risk Premium (ERP) = Total Yield - Risk Free Rate, Reflects the premium above risk free assets offered by the investment. is 4.2% Attractive operating marginsOp Mgn LTMOperating Margin = Operating Income / Revenue Reflects profitability before taxes and before impact of capital structure (interest payments). is 46% Attractive cash flow generationCFO/Rev LTMCash Flow from Operations / Revenue (Sales), Last Twelve Months (LTM) is 41%, FCF/Rev LTMFree Cash Flow / Revenue (Sales), Last Twelve Months (LTM) is 28%, CFO LTM is 11 Bil, FCF LTM is 7.8 Bil Stock buyback supportStock Buyback 3Y Total is 8.0 Bil Low stock price volatilityVol 12M is 19% Megatrend and thematic driversMegatrends include E-commerce & Digital Retail, Vegan & Alternative Foods, and Experience Economy & Premiumization. Themes include Direct-to-Consumer Brands, Show more. | Weak multi-year price returns2Y Excs Rtn is -48%, 3Y Excs Rtn is -71% | Expensive valuation multiplesP/SPrice/Sales ratio is 6.2x Key risksMCD key risks include potential damage to its brand reputation and consumer trust from [1] failing to adapt to evolving consumer preferences for healthier options and [2] negative perception caused by boycotts or food safety issues. |
| Attractive yieldTotal YieldTotal Yield = Earnings Yield + Dividend Yield, Earnings Yield = Net Income / Market Cap Dividend Yield = Total Dividends / Market Cap is 8.1%, Dividend Yield is 3.0%, ERPEquity Risk Premium (ERP) = Total Yield - Risk Free Rate, Reflects the premium above risk free assets offered by the investment. is 4.2% |
| Attractive operating marginsOp Mgn LTMOperating Margin = Operating Income / Revenue Reflects profitability before taxes and before impact of capital structure (interest payments). is 46% |
| Attractive cash flow generationCFO/Rev LTMCash Flow from Operations / Revenue (Sales), Last Twelve Months (LTM) is 41%, FCF/Rev LTMFree Cash Flow / Revenue (Sales), Last Twelve Months (LTM) is 28%, CFO LTM is 11 Bil, FCF LTM is 7.8 Bil |
| Stock buyback supportStock Buyback 3Y Total is 8.0 Bil |
| Low stock price volatilityVol 12M is 19% |
| Megatrend and thematic driversMegatrends include E-commerce & Digital Retail, Vegan & Alternative Foods, and Experience Economy & Premiumization. Themes include Direct-to-Consumer Brands, Show more. |
| Weak multi-year price returns2Y Excs Rtn is -48%, 3Y Excs Rtn is -71% |
| Expensive valuation multiplesP/SPrice/Sales ratio is 6.2x |
| Key risksMCD key risks include potential damage to its brand reputation and consumer trust from [1] failing to adapt to evolving consumer preferences for healthier options and [2] negative perception caused by boycotts or food safety issues. |
Qualitative Assessment
AI Analysis | Feedback
McDonald's (MCD) stock has lost about 10% since 6/30/2026 because of the following key factors:
1. Weak U.S. Comparable Sales and Revenue Miss in Fiscal Q2 2026.
McDonald's reported its fiscal Q2 2026 earnings on August 4, 2026. While earnings per share of $3.38 surpassed analysts' expectations of $3.34, quarterly revenue of $7.10 billion fell short of the estimated $7.13 billion. A significant factor contributing to this underperformance was the slowdown in U.S. comparable sales, which grew by only 0.8% in fiscal Q2 2026, a notable decrease from 2.5% in fiscal Q2 2025. This modest growth was driven by higher average checks and a favorable product mix, but was partially offset by a decline in customer traffic. Global comparable sales also saw a substantial drop from 5.7% in fiscal Q4 2025 to 1.3% in fiscal Q2 2026.
2. Negative Analyst Sentiment and Price Target Reductions Following Investor Day.
The company's 2026 Investor Day on September 23, 2026, was met with a negative market reaction, causing shares to fall approximately 6% to a new 52-week low around $235. Several analysts subsequently lowered their price targets for McDonald's. For example, TD Cowen reduced its forecast from $282 to $270, BTIG from $350 to $295, RBC Capital from $290 to $285, and JPMorgan from $280 to $260, further lowering it to $250. A key concern highlighted by analysts was the company's commitment of $8.5 billion in franchisee support through 2036.
Show more
McDonald's (MCD) stock has lost about 10% since 6/30/2026 because of the following key factors:
1. Weak U.S. Comparable Sales and Revenue Miss in Fiscal Q2 2026.
McDonald's reported its fiscal Q2 2026 earnings on August 4, 2026. While earnings per share of $3.38 surpassed analysts' expectations of $3.34, quarterly revenue of $7.10 billion fell short of the estimated $7.13 billion. A significant factor contributing to this underperformance was the slowdown in U.S. comparable sales, which grew by only 0.8% in fiscal Q2 2026, a notable decrease from 2.5% in fiscal Q2 2025. This modest growth was driven by higher average checks and a favorable product mix, but was partially offset by a decline in customer traffic. Global comparable sales also saw a substantial drop from 5.7% in fiscal Q4 2025 to 1.3% in fiscal Q2 2026.
2. Negative Analyst Sentiment and Price Target Reductions Following Investor Day.
The company's 2026 Investor Day on September 23, 2026, was met with a negative market reaction, causing shares to fall approximately 6% to a new 52-week low around $235. Several analysts subsequently lowered their price targets for McDonald's. For example, TD Cowen reduced its forecast from $282 to $270, BTIG from $350 to $295, RBC Capital from $290 to $285, and JPMorgan from $280 to $260, further lowering it to $250. A key concern highlighted by analysts was the company's commitment of $8.5 billion in franchisee support through 2036.
3. Macroeconomic Headwinds Impacting Consumer Spending and Restaurant Traffic.
McDonald's faced significant macroeconomic pressures, including persistent inflation and softened consumer spending, which led to reduced restaurant traffic. Restaurant prices were 3.4% higher in August 2026 compared to the previous year, with food-away-from-home prices projected to increase by 3.5% in 2026. A survey revealed that half of consumers found it harder to cover expenses than a year ago, indicating a squeeze on household incomes. This environment led to softer demand from Quick Service Restaurant (QSR) customers, impacting volumes and foot traffic, particularly in the U.S. and EMEA regions.
Show less
Stock Movement Drivers
Fundamental Drivers
The -9.5% change in MCD stock from 6/30/2026 to 10/18/2026 was primarily driven by a -10.8% change in the company's P/E Multiple.| (LTM values as of) | 6302026 | 10182026 | Change |
|---|---|---|---|
| Stock Price ($) | 268.40 | 242.97 | -9.5% |
| Change Contribution By: | |||
| Total Revenues ($ Mil) | 27,445 | 27,702 | 0.9% |
| Net Income Margin (%) | 31.6% | 31.7% | 0.3% |
| P/E Multiple | 22.0 | 19.6 | -10.8% |
| Shares Outstanding (Mil) | 711 | 709 | 0.2% |
| Cumulative Contribution | -9.5% |
Market Drivers
6/30/2026 to 10/18/2026| Return | Correlation | |
|---|---|---|
| MCD | -9.5% | |
| Market (SPY) | 2.2% | -5.0% |
| Sector (XLY) | -4.1% | 26.1% |
Fundamental Drivers
The -20.7% change in MCD stock from 3/31/2026 to 10/18/2026 was primarily driven by a -23.0% change in the company's P/E Multiple.| (LTM values as of) | 3312026 | 10182026 | Change |
|---|---|---|---|
| Stock Price ($) | 306.52 | 242.97 | -20.7% |
| Change Contribution By: | |||
| Total Revenues ($ Mil) | 26,883 | 27,702 | 3.0% |
| Net Income Margin (%) | 31.9% | 31.7% | -0.4% |
| P/E Multiple | 25.5 | 19.6 | -23.0% |
| Shares Outstanding (Mil) | 711 | 709 | 0.3% |
| Cumulative Contribution | -20.7% |
Market Drivers
3/31/2026 to 10/18/2026| Return | Correlation | |
|---|---|---|
| MCD | -20.7% | |
| Market (SPY) | 17.7% | -7.2% |
| Sector (XLY) | 3.4% | 24.6% |
Fundamental Drivers
The -18.0% change in MCD stock from 9/30/2025 to 10/18/2026 was primarily driven by a -22.3% change in the company's P/E Multiple.| (LTM values as of) | 9302025 | 10182026 | Change |
|---|---|---|---|
| Stock Price ($) | 296.27 | 242.97 | -18.0% |
| Change Contribution By: | |||
| Total Revenues ($ Mil) | 26,060 | 27,702 | 6.3% |
| Net Income Margin (%) | 32.2% | 31.7% | -1.5% |
| P/E Multiple | 25.2 | 19.6 | -22.3% |
| Shares Outstanding (Mil) | 714 | 709 | 0.8% |
| Cumulative Contribution | -18.0% |
Market Drivers
9/30/2025 to 10/18/2026| Return | Correlation | |
|---|---|---|
| MCD | -18.0% | |
| Market (SPY) | 15.5% | -0.8% |
| Sector (XLY) | -5.6% | 23.0% |
Fundamental Drivers
The -0.8% change in MCD stock from 9/30/2023 to 10/18/2026 was primarily driven by a -12.3% change in the company's P/E Multiple.| (LTM values as of) | 9302023 | 10182026 | Change |
|---|---|---|---|
| Stock Price ($) | 245.04 | 242.97 | -0.8% |
| Change Contribution By: | |||
| Total Revenues ($ Mil) | 24,193 | 27,702 | 14.5% |
| Net Income Margin (%) | 33.1% | 31.7% | -4.0% |
| P/E Multiple | 22.4 | 19.6 | -12.3% |
| Shares Outstanding (Mil) | 730 | 709 | 2.9% |
| Cumulative Contribution | -0.8% |
Market Drivers
9/30/2023 to 10/18/2026| Return | Correlation | |
|---|---|---|
| MCD | -0.8% | |
| Market (SPY) | 84.7% | 15.6% |
| Sector (XLY) | 42.9% | 24.1% |
Price Returns Compared
| 2021 | 2022 | 2023 | 2024 | 2025 | 2026 | Total [1] | |
|---|---|---|---|---|---|---|---|
| Returns | |||||||
| MCD Return | 28% | 1% | 15% | 0% | 8% | -19% | 29% |
| Peers Return | 17% | -5% | 26% | 14% | -5% | 3% | 56% |
| S&P 500 Return | 27% | -19% | 24% | 23% | 16% | 14% | 108% |
Monthly Win Rates [3] | |||||||
| MCD Win Rate | 58% | 50% | 50% | 42% | 50% | 40% | |
| Peers Win Rate | 52% | 42% | 62% | 57% | 43% | 60% | |
| S&P 500 Win Rate | 75% | 42% | 67% | 75% | 67% | 50% | |
Max Drawdowns [4] | |||||||
| MCD Max Drawdown | -5% | -17% | -17% | -17% | -11% | -31% | |
| Peers Max Drawdown | -18% | -29% | -19% | -19% | -26% | -21% | |
| S&P 500 Max Drawdown | -5% | -25% | -10% | -8% | -19% | -9% | |
[1] Cumulative total returns since the beginning of 2021
[2] Peers: SBUX, CMG, YUM, QSR, TXRH. See MCD Returns vs. Peers.
[3] Win Rate = % of calendar months in which monthly returns were positive
[4] Max drawdown represents maximum peak-to-trough decline within a year
[5] 2026 data is for the year up to 10/16/2026 (YTD)
How Low Can It Go
| Event | MCD | S&P 500 |
|---|---|---|
| Summer-Fall 2023 Five Percent Yield Shock | ||
| % Loss | -15.3% | -9.5% |
| % Gain to Breakeven | 18.1% | 10.5% |
| Time to Breakeven | 60 days | 24 days |
| 2022 Inflation Shock & Fed Tightening | ||
| % Loss | -16.9% | -24.5% |
| % Gain to Breakeven | 20.3% | 32.4% |
| Time to Breakeven | 159 days | 427 days |
| 2020 COVID-19 Crash | ||
| % Loss | -36.0% | -33.7% |
| % Gain to Breakeven | 56.3% | 50.9% |
| Time to Breakeven | 156 days | 140 days |
| 2008-2009 Global Financial Crisis | ||
| % Loss | -15.2% | -53.4% |
| % Gain to Breakeven | 18.0% | 114.4% |
| Time to Breakeven | 86 days | 1085 days |
In The Past
McDonald's's stock fell -0.9% during the 2025 US Tariff Shock. Such a loss loss requires a 0.9% gain to breakeven.
Preserve Wealth
Limiting losses and compounding gains is essential to preserving wealth.
Asset Allocation
Actively managed asset allocation strategies protect wealth. Learn more.
| Event | MCD | S&P 500 |
|---|---|---|
| 2020 COVID-19 Crash | ||
| % Loss | -36.0% | -33.7% |
| % Gain to Breakeven | 56.3% | 50.9% |
| Time to Breakeven | 156 days | 140 days |
In The Past
McDonald's's stock fell -0.9% during the 2025 US Tariff Shock. Such a loss loss requires a 0.9% gain to breakeven.
Preserve Wealth
Limiting losses and compounding gains is essential to preserving wealth.
Asset Allocation
Actively managed asset allocation strategies protect wealth. Learn more.
About McDonald's (MCD)
McDonald's Corporation (MCD) is a globally recognized fast-food chain that operates and franchises restaurants in the United States and numerous international markets. As of late 2021, the company managed over 40,000 restaurants worldwide, making it one of the largest restaurant chains globally. Founded in 1940 and headquartered in Chicago, Illinois, McDonald's has built its business around providing quick-service meals to a broad customer base.
The core of McDonald's offerings includes its iconic hamburgers and cheeseburgers, alongside popular chicken sandwiches, nuggets, and wraps. Complementing these main dishes are its well-known fries, salads, and a variety of desserts like shakes, sundaes, and soft-serve cones, plus bakery items. The menu is further diversified by a breakfast selection featuring items such as biscuit and bagel sandwiches, breakfast burritos, and hotcakes, catering to morning diners. A wide range of soft drinks, coffee, and other beverages are also standard fare.
McDonald's primarily serves the mass market, appealing to a wide demographic seeking convenient, affordable, and consistent fast food. Its extensive global footprint means it caters to diners across diverse cultures and geographies, from families to individuals, students to professionals, throughout the day with its varied meal options, including breakfast, lunch, and dinner.
AI Analysis | Feedback
Here are 1-3 brief analogies to describe McDonald's:
- Coca-Cola for prepared meals: Just as Coca-Cola is a globally ubiquitous and highly consistent brand for beverages, McDonald's is the same for quick, standardized prepared meals.
- Walmart for quick meals: Similar to how Walmart provides a vast, convenient, and consistent option for everyday retail needs, McDonald's does the same for affordable and accessible quick meals.
AI Analysis | Feedback
- Hamburgers and Cheeseburgers: Classic beef patties served in buns with various toppings.
- Chicken Sandwiches and Nuggets: A variety of poultry-based options, including crispy or grilled sandwiches and bite-sized nuggets.
- Fries: McDonald's signature golden, crispy potato sticks.
- Salads and Wraps: Lighter meal options including fresh greens and various fillings wrapped in tortillas.
- Breakfast Menu Items: A dedicated selection for morning meals, featuring items like hotcakes, breakfast sandwiches, and burritos.
- Desserts and Shakes: Sweet treats such as ice cream sundaes, soft-serve cones, milkshakes, and baked goods.
- Beverages: A broad array of drinks including soft drinks, coffee, and other non-alcoholic options.
AI Analysis | Feedback
McDonald's (MCD) primarily sells to individual consumers rather than other companies. Based on its operations as a fast-food restaurant chain, its major customer categories include:
- Families and Children: A significant portion of McDonald's customer base consists of families, often attracted by child-friendly menu items like the Happy Meal, play areas in some locations, and an overall family-oriented dining experience.
- Individuals Seeking Convenience and Speed: This category includes commuters, people on lunch breaks, travelers, and anyone looking for a quick, easily accessible, and consistent meal solution, particularly during busy times or when on the go.
- Value-Conscious Consumers: Customers who prioritize affordability and seek budget-friendly meal options are a key demographic for McDonald's, often utilizing value menus, combo deals, and promotions to get a satisfying meal at a lower cost.
AI Analysis | Feedback
- Tyson Foods (TSN)
- The Coca-Cola Company (KO)
- Pilgrim's Pride (PPC)
- JBS S.A. (JBSS3.SA)
AI Analysis | Feedback
Chris Kempczinski, Chairman and Chief Executive Officer
Chris Kempczinski joined McDonald's in 2015 as Executive Vice President for strategy, business development, and innovation. He was promoted to President of McDonald's USA in October 2016 and became CEO in November 2019, also assuming the role of Chairman of the Board in 2024. Prior to McDonald's, he accumulated over 25 years of experience in consumer goods, holding senior positions at Procter & Gamble, PepsiCo, and Kraft Foods, where he served as Executive Vice President of Growth Initiatives and President of International. There is no information indicating he founded or managed other companies, sold companies to acquirers, or has a pattern of managing private equity-backed companies.
Ian Borden, Executive Vice President, Global Chief Financial Officer
Ian Borden has been with McDonald's for nearly 30 years. He began his career in the finance department in Canada and has held various international leadership and P&L roles, including Chief Financial Officer of McDonald's Russia and Eastern Europe, Managing Director of McDonald's Ukraine, and President of International Developmental Licensed and Foundational Markets. Most recently, he was President, International, overseeing all business outside of the U.S., before becoming Global Chief Financial Officer. There is no information provided indicating he founded or managed other companies, sold companies to acquirers, or has a pattern of managing private equity-backed companies.
Joe Erlinger, President, McDonald's USA
Joe Erlinger serves as the President of McDonald's USA.
Heidi B. Capozzi, Executive Vice President, Global Chief People Officer
Heidi B. Capozzi joined McDonald's in April 2020. Before McDonald's, she was the Senior Vice President of Human Resources at The Boeing Company since 2016. Her prior experience also includes leadership roles in human resources and communications at Northrop Grumman and TRW's automotive and defense business, as well as human resources, internal services, and quality for Insitu.
Warren Anderson, Senior Vice President, Global Chief Supply Chain Officer
Warren Anderson's career with McDonald's spans more than 15 years. He most recently served as Corporate Senior Vice President, Global Supply Chain, collaborating with over 100 international markets. His responsibilities include the supply and cost management of food, packaging, logistics, toys, and equipment for McDonald's restaurants worldwide. He contributed to achieving a $1 billion global cost savings target and ensured supply chain resilience during the COVID-19 pandemic.
AI Analysis | Feedback
The key risks to McDonald's (MCD) business are:
-
Inflation and Pressured Consumers Leading to Margin Compression: McDonald's faces significant challenges from stubborn inflation, which drives up input costs such as food (specifically beef) and labor expenses. This pressure on operational costs, particularly due to minimum wage hikes, directly impacts the company's margins. Simultaneously, a pressured consumer base, especially lower-income quick-service restaurant (QSR) consumers, is leading to reduced traffic. McDonald's must balance the need to offer value to attract and retain customers with increasing costs, which can compress profitability if prices cannot be raised sufficiently.
-
Geopolitical Instability and International Market Risks: As a global company with extensive international operations, McDonald's is exposed to geopolitical instability in key international markets. This includes navigating diverse economic systems, political crises, and fluctuations in foreign currency exchange rates, which can significantly affect profitability and financial reporting. Additionally, varying foreign taxation policies in different countries pose challenges for international business expansion and operations.
-
Intensifying Competition and Maintaining Customer Relevance: McDonald's operates in a highly competitive fast-food industry. The company faces ongoing challenges from competitors, which can impact its market positioning and foot traffic. To remain successful, McDonald's must continuously differentiate its customer experience, stay relevant with evolving consumer preferences (such as the demand for healthier menu options), and execute strategic plans effectively to ensure sustained customer satisfaction and prevent sales cannibalization from its own expanding store footprint.
AI Analysis | Feedback
- Shift in consumer preferences towards healthier, plant-based, and sustainably sourced food options, challenging McDonald's traditional menu and brand perception.
- Increasing reliance on and power of third-party food delivery platforms, leading to eroded profit margins, loss of direct customer relationship and data, and increased platform leverage over McDonald's operations and pricing.
AI Analysis | Feedback
- Burgers and Cheeseburgers: The global hamburger market is valued at USD 759.45 billion in 2026 and is projected to reach USD 1,168.48 billion by 2035, with a CAGR of 7.9% from 2026 to 2035. In the U.S., the burger restaurant market size was approximately USD 173.6 billion in 2025 and is expected to reach USD 177.7 billion in 2026. The burgers/sandwich segment contributed over 43% of the revenue share in the global fast food market in 2025.
- Chicken Sandwiches and Nuggets: The global fried chicken market was valued at about USD 44.56 billion in 2024 and is predicted to grow to around USD 78.92 billion by 2035, at a CAGR of 5.33% from 2025 to 2035. The U.S. quick-service chicken restaurant industry generated roughly USD 60–65 billion in annual revenue as of 2025, and its market size is estimated at USD 63.7 billion in 2026. This segment is projected to grow to approximately USD 67.2 billion by 2030.
- Beverages (Soft Drinks and Other Beverages): The global non-alcoholic beverages market was estimated at USD 1.41 trillion in 2025 and is predicted to increase to approximately USD 2.85 trillion by 2035, expanding at a CAGR of 3.78% from 2026 to 2035. The U.S. non-alcoholic beverages market size was estimated at USD 280.2 billion in 2023 and is expected to reach USD 457.0 billion by 2030, with a CAGR of 7.4% from 2024 to 2030.
- Coffee: The global coffee shop market size was approximately USD 220.41 billion in 2024 and is projected to grow to nearly USD 290.24 billion by 2032, with a CAGR of 3.5% from 2025 to 2032. The U.S. coffee shop market value was around USD 49.5 billion in 2023 and approximately USD 74.3 billion in revenue in 2025. For the broader U.S. coffee market, the size is projected to grow from USD 112.86 billion in 2025 to reach USD 175.27 billion by 2035.
AI Analysis | Feedback
McDonald's (MCD) is strategically focused on several key drivers to fuel its revenue growth over the next two to three years. These initiatives are part of its "Accelerating the Arches" strategy, emphasizing restaurant expansion, digital transformation, menu innovation, and the introduction of new restaurant concepts.
- Aggressive Restaurant Expansion: McDonald's plans its fastest period of growth in its history, aiming to expand its global restaurant count to 50,000 by 2027. This includes opening over 2,100 new restaurants worldwide in 2024, with significant development targeted in international markets such as China, alongside expansion in the United States and International Operated Markets (IOM). This substantial increase in its footprint is expected to contribute to systemwide sales growth.
- Digital Transformation and Loyalty Program Growth: The company is doubling down on its "3 Ds" – Digital, Delivery, and Drive-Thru – with a strong emphasis on enhancing its digital ecosystem. A core component is the MyMcDonald's Rewards program, which McDonald's aims to grow to 250 million active users by 2027, projecting to double loyalty program sales to $45 billion. This digital focus involves upgrading the McDonald's app, introducing web-based ordering, personalizing offers, and deploying a new universal software platform across its digital channels to improve customer experience and operational efficiency. Furthermore, the company is leveraging AI solutions to optimize drive-thru speeds and personalized app offers.
- Menu Innovation and Value Focus: McDonald's is committed to enhancing its core menu, notably through its "Best Burger" initiative, which involves over 50 changes to improve burger quality with hotter patties, softer buns, and better-melted cheese, rolling out nationwide. Beyond core improvements, the company plans to introduce new menu items and limited-time offers (LTOs) and is testing a larger burger option. A significant driver for attracting and retaining customers, especially in a pressured consumer spending environment, is its continued focus on value and affordability through initiatives like the $5 Meal Deal and Every Day Affordable Price (EDAP) menus.
- Launch of New Restaurant Concepts: To tap into new market segments and drive growth, McDonald's is introducing innovative spin-off concepts such as CosMc's. This new drive-thru-only format, focusing on customizable beverages and snacks, is designed to compete in the growing afternoon snack and beverage category, with 10 locations planned in 2024.
AI Analysis | Feedback
Share Repurchases
- McDonald's repurchased $2.056 billion of its stock in 2025.
- The company repurchased $2.824 billion in 2024.
- Share repurchases amounted to $3.054 billion in 2023.
Share Issuance
- McDonald's shares outstanding have consistently declined over the last few years, indicating that share repurchases have outweighed any share issuances. For instance, shares outstanding decreased from 744.8 million in 2021 to 712.1 million in 2025.
Outbound Investments
- In 2024, the company's cash used for investing activities increased, primarily due to an increased ownership stake in McDonald's China business and the acquisition of McDonald's business in Israel.
- Long-term investments by McDonald's were $2.71 billion in 2024, marking a significant increase from $1.08 billion in 2023.
Capital Expenditures
- Capital expenditures are projected to be between $3.7 billion and $3.9 billion in 2026, with the majority directed towards new unit openings across the U.S. and international markets, and supporting strategic growth drivers like technology and digital enhancements.
- McDonald's capital expenditures were $3.365 billion in 2025, primarily for new restaurant openings, with approximately 2,275 new restaurants opened globally in 2025.
- Capital expenditures were approximately $2.8 billion in 2024, mainly allocated to new restaurant openings and reinvestment in existing restaurants.

Peer Outperformance in Restaurants
| Ticker | Name | Rev Growth 3Y Avg | P/E | 1Y | 3Y | 5Y | 5Y Gap |
|---|---|---|---|---|---|---|---|
| MCD | McDonald's | 4.6% | 19.6x | -19.1% | 1.1% | 12.7% | — |
| CAKE | Cheesecake Factory | 4.4% | 30.0x | 116.8% | 297.1% | 199.9% | +187pp |
| DRI | Darden Restaurants | 7.5% | 20.8x | 18.6% | 67.5% | 71.6% | +59pp |
| Industry | Names | 1Y med | 3Y med | 5Y med | Top 3 by 5Y |
|---|---|---|---|---|---|
| Education Services | 14 | -19.9% | 82.6% | 91.0% | CVSA 247% · PRDO 235% · LRN 148% |
| Homebuilding | 18 | -8.6% | 40.7% | 41.3% | GRBK 181% · PHM 141% · TOL 135% |
| Specialty Stores | 7 | 15.0% | 42.6% | 15.9% | ASO 49% · DKS 31% · FIVE 16% |
| Hotels, Resorts & Cruise Lines | 21 | 11.2% | 50.2% | 13.8% | RCL 234% · MAR 154% · HLT 143% |
| Home Furnishings | 3 | -5.6% | 52.0% | 1.3% | SGI 44% · MHK -36% |
| Home Improvement Retail | 5 | -18.8% | 10.0% | -1.9% | HD -1% · LOW -2% · FND -64% |
| Automotive Retail | 17 | -13.1% | 10.3% | -8.4% | MUSA 233% · PAG 129% · ORLY 110% |
| Specialized Consumer Services | 10 | -13.0% | 23.6% | -13.2% | HRB 134% · FTDR 84% · SCI 42% |
| Footwear | 9 | 72.1% | 45.8% | -14.0% | DECK 40% · SHOO 18% · CROX -14% |
| Distributors | 4 | -9.2% | -15.4% | -15.9% | ARMK 122% · GPC 22% · LKQ -54% |
| Restaurants ← | 36 | -5.2% | -5.8% | -18.6% | EAT 322% · CAKE 200% · TXRH 102% |
| Household Appliances | 17 | -2.4% | 27.5% | -35.8% | |
| Apparel Retail | 26 | 5.1% | 7.7% | -38.4% | ANF 290% · TJX 145% · ROST 128% |
| Leisure Facilities | 12 | 10.8% | -5.8% | -41.3% | LTH 149% · OSW 117% · PLNT -37% |
| Computer & Electronics Retail | 3 | 16.2% | 54.2% | -42.4% | BBY 1% · GME -42% |
| Leisure Products | 14 | -18.3% | -17.0% | -44.9% | GOLF 78% · HAS 30% · MAT -14% |
| Automotive Parts & Equipment | 39 | -12.1% | -13.5% | -46.4% | MOD 1144% · GTX 253% · BWA 54% |
| Apparel, Accessories & Luxury Goods | 29 | 1.3% | 15.1% | -46.9% | RL 256% · TPR 254% · KTB 74% |
| Broadline Retail | 13 | 9.6% | 29.3% | -48.2% | EBAY 77% · AMZN 45% · OLLI 40% |
| Casinos & Gaming | 20 | -11.3% | -25.9% | -50.9% | MCRI 86% · BYD 10% · RRR 9% |
| Automobile Manufacturers | 8 | -73.4% | -53.6% | -77.7% | GM 54% · TSLA 22% · F 9% |
| Other Specialty Retail | 17 | -34.0% | -32.7% | -77.8% | ULTA 46% · TSCO -11% · BBWI -66% |
| Consumer Electronics | 11 | -27.6% | -33.4% | -78.3% | GRMN 98% · SONO -47% |
Latest Trefis Analyses
| Title | Date | |
|---|---|---|
| DASHBOARDS | ||
| McDonald's Stock at Support Zone - Bargain or Trap? | 06/18/2026 | |
| EAT, QSR Beat McDonald's Stock on Price & Growth | 06/09/2026 | |
| McDonald's Earnings Notes | 05/06/2026 | |
| Should You Buy McDonald's Stock? | 05/02/2026 | |
| McDonald's Stock Slides 5.6% With A 5-Day Losing Spree | 03/24/2026 | |
| How Low Can McDonald's Stock Really Go? | 10/17/2025 | |
| How Does McDonald's Stock Stack Up Against Its Peers? | 08/13/2025 | |
| ARTICLES | ||
| Where Could McDonald’s Next Growth Come From? | 10/09/2026 | |
| Your McDonald’s Stock Thesis Has One Loose End | 09/24/2026 | |
| One Reason McDonald’s Stock Looks Better Than Its Price | 09/24/2026 | |
| The 52-Week-Low List: 28 S&P 500 Names On Wednesday | 09/24/2026 | |
| Why Has McDonald’s Gone Quiet On Its Low-Income Customer? | 09/17/2026 |
Research & Analysis
Invest in Strategies
Wealth Management
Peer Comparisons
| Peers to compare with: |
Financials
| Median | |
|---|---|
| Name | |
| Mkt Price | 123.91 |
| Mkt Cap | 39.8 |
| Rev LTM | 11,061 |
| Op Inc LTM | 2,632 |
| FCF LTM | 1,656 |
| FCF 3Y Avg | 1,486 |
| CFO LTM | 2,205 |
| CFO 3Y Avg | 1,974 |
Growth & Margins
| Median | |
|---|---|
| Name | |
| Rev Chg LTM | 6.9% |
| Rev Chg 3Y Avg | 9.0% |
| Rev Chg Q | 6.9% |
| QoQ Delta Rev Chg LTM | 1.7% |
| Op Inc Chg LTM | 3.1% |
| Op Inc Chg 3Y Avg | 7.0% |
| Op Mgn LTM | 21.2% |
| Op Mgn 3Y Avg | 22.0% |
| QoQ Delta Op Mgn LTM | -0.2% |
| CFO/Rev LTM | 19.2% |
| CFO/Rev 3Y Avg | 18.2% |
| FCF/Rev LTM | 14.7% |
| FCF/Rev 3Y Avg | 14.2% |
Valuation
| Median | |
|---|---|
| Name | |
| Mkt Cap | 39.8 |
| P/S | 3.0 |
| P/Op Inc | 17.8 |
| P/EBIT | 17.6 |
| P/E | 23.6 |
| P/CFO | 15.8 |
| Total Yield | 6.4% |
| Dividend Yield | 2.2% |
| FCF Yield 3Y Avg | 3.5% |
| D/E | 0.2 |
| Net D/E | 0.2 |
Returns
| Median | |
|---|---|
| Name | |
| 1M Rtn | 0.8% |
| 3M Rtn | -8.0% |
| 6M Rtn | -4.7% |
| 12M Rtn | 0.9% |
| 3Y Rtn | 18.4% |
| 1M Excs Rtn | 0.3% |
| 3M Excs Rtn | -10.6% |
| 6M Excs Rtn | -12.2% |
| 12M Excs Rtn | -12.3% |
| 3Y Excs Rtn | -53.5% |
Comparison Analyses
Segment Financials
Revenue by Segment| $ Mil | 2025 | 2024 | 2023 | 2022 | 2021 |
|---|---|---|---|---|---|
| International Operated Markets | 13,633 | 12,628 | 12,382 | 11,297 | 12,220 |
| United States (US) | 10,825 | 10,631 | 10,568 | 9,588 | 8,865 |
| International Developmental Licensed Markets & Corporate | 2,427 | 2,661 | 2,543 | 2,297 | 2,138 |
| Total | 26,885 | 25,920 | 25,493 | 23,182 | 23,223 |
| $ Mil | 2025 | 2024 | 2023 | 2022 | 2021 |
|---|---|---|---|---|---|
| International Operated Markets | 6,382 | 5,946 | 5,831 | 3,926 | 5,131 |
| United States (US) | 5,808 | 5,733 | 5,694 | 5,136 | 4,755 |
| International Developmental Licensed Markets & Corporate | 203 | 33 | 121 | 309 | 471 |
| Total | 12,393 | 11,712 | 11,646 | 9,371 | 10,356 |
| $ Mil | 2025 | 2024 | 2023 | 2022 | 2021 |
|---|---|---|---|---|---|
| International Operated Markets | 27,487 | 23,491 | 23,947 | 21,979 | 24,186 |
| United States (US) | 23,008 | 22,547 | 22,477 | 21,793 | 21,280 |
| International Developmental Licensed Markets & Corporate | 9,020 | 9,143 | 9,723 | 6,663 | 8,388 |
| Total | 59,515 | 55,181 | 56,147 | 50,435 | 53,854 |
Price Behavior
| Market Price | $242.97 | |
| Market Cap ($ Bil) | 172.3 | |
| First Trading Date | 01/02/1970 | |
| Distance from 52W High | -27.4% | |
| 50 Days | 200 Days | |
| DMA Price | $251.82 | $282.79 |
| DMA Trend | down | down |
| Distance from DMA | -3.5% | -14.1% |
| 3M | 1YR | |
| Volatility | 20.0% | 19.3% |
| Downside Capture | 37.13 | 23.40 |
| Upside Capture | -16.48 | -4.39 |
| Correlation (S&P 500) | -2.9% | 1.7% |
| 1M | 2M | 3M | 6M | 1Y | 3Y | |
|---|---|---|---|---|---|---|
| Beta | 0.55 | 0.10 | -0.04 | -0.09 | 0.00 | 0.19 |
| Up Beta | -0.03 | 0.11 | -0.43 | 0.22 | 0.26 | 0.20 |
| Down Beta | 2.60 | 2.16 | 1.29 | -0.02 | -0.03 | 0.13 |
| Up Capture | -20% | -55% | -46% | -35% | -13% | 4% |
| Bmk +ve Days | 6 | 16 | 27 | 66 | 132 | 424 |
| Stock +ve Days | 4 | 16 | 23 | 52 | 114 | 377 |
| Down Capture | 180% | 81% | 35% | 17% | 11% | 49% |
| Bmk -ve Days | 16 | 26 | 37 | 60 | 120 | 328 |
| Stock -ve Days | 18 | 26 | 41 | 74 | 138 | 374 |
[1] Upside and downside betas calculated using positive and negative benchmark daily returns respectively
Based On 1-Year Data
| Annualized Return | Annualized Volatility | Sharpe Ratio | Correlation with MCD | |
|---|---|---|---|---|
| MCD | -18.4% | 19.3% | -1.18 | - |
| Sector ETF (XLY) | -3.6% | 19.2% | -0.32 | 24.6% |
| Equity (SPY) | 15.8% | 12.7% | 0.86 | 0.4% |
| Gold (GLD) | -1.4% | 29.4% | -0.05 | 5.0% |
| Commodities (DBC) | 52.4% | 20.7% | 1.92 | -21.2% |
| Real Estate (VNQ) | 4.8% | 13.7% | 0.09 | 37.4% |
| Bitcoin (BTCUSD) | -26.5% | 43.6% | -0.59 | -4.1% |
Smart multi-asset allocation framework can stack odds in your favor. Learn How
Based On 5-Year Data
| Annualized Return | Annualized Volatility | Sharpe Ratio | Correlation with MCD | |
|---|---|---|---|---|
| MCD | 2.0% | 17.9% | -0.02 | - |
| Sector ETF (XLY) | 5.1% | 24.1% | 0.17 | 32.8% |
| Equity (SPY) | 13.2% | 17.1% | 0.59 | 33.4% |
| Gold (GLD) | 18.4% | 18.9% | 0.79 | 6.7% |
| Commodities (DBC) | 9.9% | 19.5% | 0.39 | -5.2% |
| Real Estate (VNQ) | 1.6% | 18.8% | -0.02 | 40.5% |
| Bitcoin (BTCUSD) | 8.6% | 51.8% | 0.34 | 5.8% |
Smart multi-asset allocation framework can stack odds in your favor. Learn How
Based On 10-Year Data
| Annualized Return | Annualized Volatility | Sharpe Ratio | Correlation with MCD | |
|---|---|---|---|---|
| MCD | 10.5% | 20.6% | 0.45 | - |
| Sector ETF (XLY) | 12.0% | 22.2% | 0.49 | 48.5% |
| Equity (SPY) | 15.2% | 17.9% | 0.72 | 51.9% |
| Gold (GLD) | 12.3% | 16.4% | 0.61 | 7.0% |
| Commodities (DBC) | 8.3% | 18.1% | 0.37 | 12.5% |
| Real Estate (VNQ) | 5.2% | 20.7% | 0.21 | 54.0% |
| Bitcoin (BTCUSD) | 63.1% | 66.2% | 1.03 | 11.4% |
Smart multi-asset allocation framework can stack odds in your favor. Learn How
Returns Analyses
Earnings Returns History
Updated 9/4/2026| Forward Returns | |||
|---|---|---|---|
| Earnings Date | 1D Returns | 5D Returns | 21D Returns |
| 8/4/2026 | 1.2% | 3.2% | -0.9% |
| 5/7/2026 | -0.1% | -3.0% | -0.8% |
| 2/11/2026 | 2.7% | 1.2% | 1.6% |
| 11/5/2025 | 2.2% | 2.5% | 4.6% |
| 8/6/2025 | 3.0% | 1.0% | 6.7% |
| 5/1/2025 | -1.9% | -0.5% | -1.8% |
| 2/10/2025 | 4.8% | 4.8% | 4.8% |
| 10/29/2024 | -0.6% | -1.3% | -0.2% |
| ... | |||
| SUMMARY STATS | |||
| # Positive | 13 | 15 | 12 |
| # Negative | 11 | 9 | 12 |
| Median Positive | 2.7% | 3.2% | 4.7% |
| Median Negative | -0.6% | -1.5% | -2.1% |
| Max Positive | 4.8% | 9.8% | 14.6% |
| Max Negative | -3.7% | -3.8% | -8.8% |
| Forward Returns | |||
|---|---|---|---|
| Earnings Date | 1D Returns | 5D Returns | 21D Returns |
| 8/4/2026 | 1.2% | 3.2% | -0.9% |
| 5/7/2026 | -0.1% | -3.0% | -0.8% |
| 2/11/2026 | 2.7% | 1.2% | 1.6% |
| 11/5/2025 | 2.2% | 2.5% | 4.6% |
| 8/6/2025 | 3.0% | 1.0% | 6.7% |
| 5/1/2025 | -1.9% | -0.5% | -1.8% |
| 2/10/2025 | 4.8% | 4.8% | 4.8% |
| 10/29/2024 | -0.6% | -1.3% | -0.2% |
| 7/29/2024 | 3.7% | 9.8% | 14.6% |
| 4/30/2024 | -0.2% | -1.6% | -8.8% |
| 2/5/2024 | -3.7% | -2.6% | -1.0% |
| 10/30/2023 | 1.7% | 4.7% | 10.3% |
| 7/27/2023 | 1.2% | -0.7% | -3.2% |
| 4/25/2023 | -0.6% | 1.5% | -2.3% |
| 1/31/2023 | -1.3% | -1.1% | -2.5% |
| 10/27/2022 | 3.3% | 5.4% | 7.2% |
| 7/26/2022 | 2.7% | 5.5% | 4.1% |
| 4/28/2022 | 2.9% | 2.9% | 0.4% |
| 1/27/2022 | -0.4% | 5.0% | -0.2% |
| 10/27/2021 | 2.7% | 5.4% | 8.8% |
| 7/28/2021 | -1.9% | -3.8% | -3.1% |
| 4/29/2021 | 1.2% | 1.1% | 1.1% |
| 1/28/2021 | -0.1% | 0.8% | 0.2% |
| 11/9/2020 | -1.5% | -1.5% | -3.2% |
| SUMMARY STATS | |||
| # Positive | 13 | 15 | 12 |
| # Negative | 11 | 9 | 12 |
| Median Positive | 2.7% | 3.2% | 4.7% |
| Median Negative | -0.6% | -1.5% | -2.1% |
| Max Positive | 4.8% | 9.8% | 14.6% |
| Max Negative | -3.7% | -3.8% | -8.8% |
SEC Filings
Expand for More| Report Date | Filing Date | Filing |
|---|---|---|
| 06/30/2026 | 08/07/2026 | 10-Q |
| 03/31/2026 | 05/07/2026 | 10-Q |
| 12/31/2025 | 02/24/2026 | 10-K |
| 09/30/2025 | 11/05/2025 | 10-Q |
| 06/30/2025 | 08/06/2025 | 10-Q |
| 03/31/2025 | 05/12/2025 | 10-Q |
| 12/31/2024 | 02/25/2025 | 10-K |
| 09/30/2024 | 11/07/2024 | 10-Q |
| 06/30/2024 | 08/08/2024 | 10-Q |
| 03/31/2024 | 05/08/2024 | 10-Q |
| 12/31/2023 | 02/22/2024 | 10-K |
| 09/30/2023 | 11/02/2023 | 10-Q |
| 06/30/2023 | 08/02/2023 | 10-Q |
| 03/31/2023 | 05/04/2023 | 10-Q |
| 12/31/2022 | 02/24/2023 | 10-K |
| 09/30/2022 | 11/07/2022 | 10-Q |
| Report Date | Filing Date | Filing |
|---|---|---|
| 06/30/2026 | 08/07/2026 | 10-Q |
| 03/31/2026 | 05/07/2026 | 10-Q |
| 12/31/2025 | 02/24/2026 | 10-K |
| 09/30/2025 | 11/05/2025 | 10-Q |
| 06/30/2025 | 08/06/2025 | 10-Q |
| 03/31/2025 | 05/12/2025 | 10-Q |
| 12/31/2024 | 02/25/2025 | 10-K |
| 09/30/2024 | 11/07/2024 | 10-Q |
| 06/30/2024 | 08/08/2024 | 10-Q |
| 03/31/2024 | 05/08/2024 | 10-Q |
| 12/31/2023 | 02/22/2024 | 10-K |
| 09/30/2023 | 11/02/2023 | 10-Q |
| 06/30/2023 | 08/02/2023 | 10-Q |
| 03/31/2023 | 05/04/2023 | 10-Q |
| 12/31/2022 | 02/24/2023 | 10-K |
| 09/30/2022 | 11/07/2022 | 10-Q |
| 06/30/2022 | 08/04/2022 | 10-Q |
| 03/31/2022 | 05/02/2022 | 10-Q |
| 12/31/2021 | 02/24/2022 | 10-K |
| 09/30/2021 | 11/02/2021 | 10-Q |
| 06/30/2021 | 08/04/2021 | 10-Q |
| 03/31/2021 | 05/05/2021 | 10-Q |
| 12/31/2020 | 02/23/2021 | 10-K |
| 09/30/2020 | 11/09/2020 | 10-Q |
| 06/30/2020 | 08/10/2020 | 10-Q |
| 03/31/2020 | 05/07/2020 | 10-Q |
| 12/31/2019 | 02/26/2020 | 10-K |
| 09/30/2019 | 11/04/2019 | 10-Q |
Insider Activity
Updated 8/11/2026| # | Owner | Title | Holding | Action | Filing Date | Price | Shares | Transacted Value | Value of Held Shares | Form |
|---|---|---|---|---|---|---|---|---|---|---|
| 1 | Erlinger, Joseph M | President, McDonald's USA | Direct | Sell | 6102026 | 284.32 | 5,252 | 1,493,249 | 2,198,900 | Form |
| 2 | Ralls-Morrison, Desiree | EVP, Chief Legal Officer | Direct | Sell | 5302026 | 278.36 | 2,763 | 769,109 | 1,744,794 | Form |
| 3 | Erlinger, Joseph M | President, McDonald's USA | Direct | Sell | 5272026 | 280.11 | 333 | 93,277 | 2,166,340 | Form |
| 4 | Erlinger, Joseph M | President, McDonald's USA | Direct | Sell | 4232026 | 302.72 | 333 | 100,806 | 2,442,009 | Form |
| 5 | Erlinger, Joseph M | President, McDonald's USA | Direct | Sell | 4122026 | 307.00 | 2,626 | 806,182 | 2,578,766 | Form |
| # | Owner | Title | Holding | Action | Filing Date | Price | Shares | Transacted Value | Value of Held Shares | Form |
|---|---|---|---|---|---|---|---|---|---|---|
| 1 | Erlinger, Joseph M | President, McDonald's USA | Direct | Sell | 6102026 | 284.32 | 5,252 | 1,493,249 | 2,198,900 | Form |
| 2 | Ralls-Morrison, Desiree | EVP, Chief Legal Officer | Direct | Sell | 5302026 | 278.36 | 2,763 | 769,109 | 1,744,794 | Form |
| 3 | Erlinger, Joseph M | President, McDonald's USA | Direct | Sell | 5272026 | 280.11 | 333 | 93,277 | 2,166,340 | Form |
| 4 | Erlinger, Joseph M | President, McDonald's USA | Direct | Sell | 4232026 | 302.72 | 333 | 100,806 | 2,442,009 | Form |
| 5 | Erlinger, Joseph M | President, McDonald's USA | Direct | Sell | 4122026 | 307.00 | 2,626 | 806,182 | 2,578,766 | Form |
| 6 | Erlinger, Joseph M | President, McDonald's USA | Direct | Sell | 3242026 | 313.47 | 333 | 104,386 | 2,633,114 | Form |
| 7 | Baroni, Dario | President, IDL | Direct | Sell | 3192026 | 323.77 | 600 | 194,262 | 344,190 | Form |
| 8 | Erlinger, Joseph M | President, McDonald's USA | Direct | Sell | 3112026 | 328.34 | 2,626 | 862,221 | 2,867,357 | Form |
| 9 | Erlinger, Joseph M | President, McDonald's USA | Direct | Sell | 2242026 | 330.43 | 333 | 110,033 | 2,885,609 | Form |
| 10 | Banner, Jonathan | EVP - Chief Impact Officer | Direct | Sell | 2242026 | 333.29 | 6,201 | 2,066,596 | 763,589 | Form |
| 11 | Kempczinski, Christopher J | Chairman and CEO | Direct | Sell | 2172026 | 333.54 | 26,276 | 8,764,097 | 7,638,113 | Form |
| 12 | Kempczinski, Christopher J | Chairman and CEO | Direct | Sell | 2172026 | 331.35 | 26,277 | 8,706,884 | 7,587,961 | Form |
| 13 | Flatley, Edith Morgan | EVP - Global CMO | Direct | Sell | 2172026 | 331.00 | 4,692 | 1,553,052 | 2,052,054 | Form |
| 14 | Erlinger, Joseph M | President, McDonald's USA | Direct | Sell | 2112026 | 325.25 | 2,626 | 854,106 | 1,755,739 | Form |
| 15 | Erlinger, Joseph M | President, McDonald's USA | Direct | Sell | 1132026 | 306.58 | 2,626 | 805,079 | 1,654,956 | Form |
| 16 | Ralls-Morrison, Desiree | EVP, Chief Legal Officer | Direct | Sell | 12182025 | 320.00 | 2,486 | 795,520 | 2,005,763 | Form |
| 17 | Flatley, Edith Morgan | EVP - Global CMO | Direct | Sell | 12152025 | 315.00 | 658 | 207,270 | 1,952,861 | Form |
| 18 | Steijaert, Manuel JM | EVP - President, IOM | Direct | Sell | 12022025 | 305.50 | 6,567 | 2,006,218 | 1,407,164 | Form |
| 19 | Borden, Ian Frederick | EVP - CFO | Direct | Sell | 11212025 | 310.00 | 17,134 | 5,311,540 | 8,169,476 | Form |
| 20 | Erlinger, Joseph M | President, McDonald's USA | Direct | Sell | 11182025 | 305.82 | 3,195 | 977,095 | 1,861,869 | Form |
| 21 | Steijaert, Manuel JM | EVP - President, IOM | Direct | Sell | 11072025 | 300.42 | 13,134 | 3,945,716 | 1,383,765 | Form |
| 22 | Flatley, Edith Morgan | EVP - Global CMO | Direct | Sell | 9022025 | 315.00 | 1,000 | 315,000 | 2,160,131 | Form |
| 23 | Flatley, Edith Morgan | EVP - Global CMO | Direct | Sell | 8202025 | 315.00 | 4,716 | 1,485,540 | 2,475,131 | Form |
| 24 | Banner, Jonathan | EVP - Chief Impact Officer | Direct | Sell | 8192025 | 310.00 | 1,000 | 310,000 | 30,585 | Form |
| 25 | Ralls-Morrison, Desiree | EVP, Chief Legal Officer | Direct | Sell | 8062025 | 310.00 | 2,487 | 770,970 | 2,713,743 | Form |
| 26 | Flatley, Edith Morgan | EVP - Global CMO | Direct | Sell | 8042025 | 303.50 | 976 | 296,216 | 2,392,053 | Form |
Investor Activity (13F)
Updated Oct 19, 2026Active managers (13F portfolio over $250M, at least 3 holdings) with a position over $5M that is either over 10% of their portfolio or held in a concentrated book of 50 or fewer total positions. Index/ETF, sovereign, bank, community-bank and charitable/donor-advised filers are excluded.
| Active Manager | Value | % of Portfolio | Total Positions | QoQ | Filing |
|---|---|---|---|---|---|
| Gallagher Fiduciary Advisors, LLC | $1.3 Bil | 52.2% | 362 | Hold | 13F |
| RIT Capital Partners PLC | $21.0 Mil | 5.6% | 12 | TRIM -21.1% | 13F |
| Focused Investors LLC | $126.6 Mil | 4.1% | 22 | Hold | 13F |
| HS Management Partners, LLC | $11.1 Mil | 3.9% | 24 | TRIM -56.4% | 13F |
| Westchester Capital Management, Inc. | $16.0 Mil | 3.2% | 45 | Hold | 13F |
| Cambridge Financial Group, Inc. | $8.4 Mil | 3.2% | 33 | Hold | 13F |
| Cartenna Capital, LP | $68.4 Mil | 3.0% | 41 | TRIM -22.8% | 13F |
| Hook Mill Capital Partners, LP | $25.6 Mil | 2.3% | 39 | New | 13F |
| Kinsale Capital Group, Inc. | $11.5 Mil | 1.8% | 41 | ADD +5.5% | 13F |
| KCM Capital Inc | $6.9 Mil | 1.3% | 31 | Hold | 13F |
| Generali Powszechne Towarzystwo Emerytalne | $6.3 Mil | 1.1% | 28 | Hold | 13F |
| Troy Asset Management Ltd | $22.3 Mil | 0.7% | 30 | TRIM -8.3% | 13F |
| Gates Foundation Trust | $104.1 Mil | 0.3% | 22 | Hold | 13F |
| Active Manager | Value | % of Portfolio | Total Positions | QoQ | As Of | Filing |
|---|---|---|---|---|---|---|
| Anomaly Capital Management, LP | $76.9 Mil | 2.8% | 32 | Exited | Dec 31, 2025 | 13F |
| HS Management Partners, LLC | $11.1 Mil | 3.9% | 24 | TRIM -56.4% | Mar 31, 2026 | 13F |
| Cartenna Capital, LP | $68.4 Mil | 3.0% | 41 | TRIM -22.8% | Mar 31, 2026 | 13F |
| RIT Capital Partners PLC | $21.0 Mil | 5.6% | 12 | TRIM -21.1% | Mar 31, 2026 | 13F |
| Troy Asset Management Ltd | $22.3 Mil | 0.7% | 30 | TRIM -8.3% | Mar 31, 2026 | 13F |
| Active Manager | Value | % of Portfolio | Total Positions | QoQ | Filing |
|---|---|---|---|---|---|
| Gallagher Fiduciary Advisors, LLC | $1.3 Bil | 52.2% | 362 | Hold | 13F |
| Focused Investors LLC | $126.6 Mil | 4.1% | 22 | Hold | 13F |
| Gates Foundation Trust | $104.1 Mil | 0.3% | 22 | Hold | 13F |
| Cartenna Capital, LP | $68.4 Mil | 3.0% | 41 | TRIM -22.8% | 13F |
| Hook Mill Capital Partners, LP | $25.6 Mil | 2.3% | 39 | New | 13F |
| Troy Asset Management Ltd | $22.3 Mil | 0.7% | 30 | TRIM -8.3% | 13F |
| RIT Capital Partners PLC | $21.0 Mil | 5.6% | 12 | TRIM -21.1% | 13F |
| Westchester Capital Management, Inc. | $16.0 Mil | 3.2% | 45 | Hold | 13F |
| Kinsale Capital Group, Inc. | $11.5 Mil | 1.8% | 41 | ADD +5.5% | 13F |
| HS Management Partners, LLC | $11.1 Mil | 3.9% | 24 | TRIM -56.4% | 13F |
| Cambridge Financial Group, Inc. | $8.4 Mil | 3.2% | 33 | Hold | 13F |
| KCM Capital Inc | $6.9 Mil | 1.3% | 31 | Hold | 13F |
| Generali Powszechne Towarzystwo Emerytalne | $6.3 Mil | 1.1% | 28 | Hold | 13F |
MCD Trade Sentinel
Constructive
CONVICTION RATIONALE
The company's highly profitable franchise model provides a stable foundation while new U.S. leadership executes a turnaround. While U.S. customer traffic declined in Q2 2026, a clear strategy is in place, with key initiatives like a 'Best Burger' rollout planned for 2026. Success hinges on executing this operational fix.
STOCK ARCHETYPE
Transactional - Consumer Discretionary (Franchise & Royalties)Systemwide Sales = (Comparable Restaurant Sales Growth % + Net Restaurant Unit Growth %) Franchise Margin. The heavily franchised model (95% of restaurants) generates high-margin, stable revenue from rent and royalties, which is less volatile than direct restaurant operations.
INVESTMENT THESIS
Evidence points to a company in transition, with a credible plan to fix recent operational stumbles in its largest market.
- A new U.S. President was appointed effective August 4, 2026.
- The 'Best Burger' initiative is on track for nearly all markets by the end of 2026.
- A system-wide retraining program for over 2 million people will launch on October 5.
- International segments are guided to see accelerating comp sales growth in Q3 2026.
- The company generates strong free cash flow, fully funding a 7.3% total yield.
PRIMARY RISK
The U.S. slowdown, with comparable sales at just 0.8% and negative guest counts, could persist if the new strategy fails to resonate with consumers or gain franchisee support. This would signal deeper issues than temporary missteps.
- U.S. comparable sales growth slowed to 0.8% in Q2 2026, below expectations.
- Q2 U.S. growth was offset by negative comparable guest counts.
- Management guided that U.S. comps were slightly negative in July 2026.
- The 50,000 global restaurant target was delayed from 2027 to 2028.
- Operating expenses grew 14.3% in the last year, outpacing 6.3% revenue growth.
| KPI | Status | Rationale |
|---|---|---|
| Global Comparable Sales | 1.3% for the second quarter of 2026 - Decelerating | Global comparable sales growth has decelerated for three consecutive quarters, indicating a significant slowdown in business momentum. Management noted a challenging consumer environment with flat to negative QSR industry traffic in several large markets. |
| U.S. Comparable Sales | 0.8% for the second quarter of 2026 - Decelerating | U.S. comparable sales growth has slowed sharply over the past three quarters, falling to near-stagnant levels. Management stated this performance was "below our expectations" and attributed it to internal execution failures. |
| Systemwide Sales Growth (Constant Currency) | 4% (Q2 2026) | Measures the sales growth of all restaurants in the system, including both company-owned and franchised locations. It reflects both comparable sales performance and net restaurant expansion. |
| Net Restaurant Additions | 2,100 (expected) (Full Year 2026) | Represents the net increase in the total number of restaurants globally, a primary driver of systemwide sales growth alongside comparable sales. |
Resilient Global Model vs. U.S. Execution Crisis
BULL VIEW
Bulls believe the stable, high-margin international business and 95% franchised model provide the financial strength to fund and execute a U.S. recovery under new leadership, addressing recent operational issues.
CORE TENSION
Can resilient international operations, guided to accelerate, offset the U.S. sales miss to 0.8% growth, a dynamic the market looked past in the last earnings report?
PREVAILING SENTIMENT
The latest evidence favors the bulls. The market reacted positively to the decisive leadership change and turnaround plan, despite the weak U.S. sales figure, suggesting confidence in a recovery.
BEAR VIEW
Bears worry the U.S. segment's negative guest counts signal a loss of value perception that a new strategy cannot easily fix, potentially leading to sustained market share loss to peers.
| Timeline | Event & Metric To Watch |
|---|---|
11/2/2026 | Peer Outperformance Signals Share Loss Watch: Comparable sales growth from YUM and TXRH relative to MCD's Q3 results. |
11/3/2026 | Continued US Traffic Decline Watch: The guest count component of U.S. comparable sales in the next earnings report. |
11/3/2026 | Next Quarterly Earnings Report Watch: The company is scheduled to report its next quarterly earnings. |
11/4/2026 | Peer Texas Roadhouse Earnings Watch: Peer Texas Roadhouse (TXRH) is scheduled to report earnings. |
No set date | Ineffective Value Strategy Relaunch Watch: Commentary on franchisee adoption of value programs and performance of new digital offers. |
No set date | Elevated Market Uncertainty Priced In Watch: Stock price reaction to Q3 earnings, given the high level of priced-in uncertainty. |
October 5 | System-Wide Retraining Program Launch Watch: The company will launch a program to retrain over 2 million restaurant crew, company employees, and supplier partners. |
September 23 | Investor Day Event Watch: The company will hold an Investor Day in Chicago. |
| Date | Event | Stock Impact |
|---|---|---|
2026-08-04 | Names New US President Details: The company named 26-year veteran Skye Anderson as its new U.S. president, succeeding Joe Erlinger, as growth in its largest market slowed. | +3.3% $265.23 -> $274.00 |
2026-08-04 | Reports Q2 US Sales Miss Details: The company reported Q2 U.S. comparable sales growth of 0.8%, missing expectations. However, earnings per share of $3.38 beat estimates, and the stock rose 3.0%. | +3.3% $265.23 -> $274.00 |
2026-06-01 | Unveils 'McDonald's > NEXT' Strategy Details: At its Worldwide Convention, the company unveiled its 'McDonald's > NEXT' global growth plan, focusing on better food, consumer-led innovation, and improved service to address rising competition. | -0.3% $277.32 -> $276.36 |
2026-05-13 | Announces Chicago Stadium Naming Deal Details: McDonald's announced its first-ever naming rights partnership for a major U.S. professional sports stadium with the Chicago Fire Football Club. 'McDonald's Park' is set to open in 2028. | +0.0% $272.99 -> $273.12 |
2026-05-07 | Stock Falls Despite Q1 Beat Details: The company reported Q1 global comparable sales growth of 3.8%, beating estimates. However, the stock fell -3.0% in the two days around the announcement. | -2.9% $282.19 -> $273.89 |
2026-04-21 | Analyst Trims Q1 Sales Outlook Details: An analyst note trimmed first-quarter sales forecasts, citing signs of softer consumer demand in March. | -2.2% $304.87 -> $298.05 |
2026-02-11 | Reports Strong Q4 2025 Results Details: The company reported Q4 2025 comparable sales growth of over 5.5%. The stock reacted positively, rising 2.0% over two days. | +1.9% $321.98 -> $328.01 |
Position Sizing
2% - 4%
REDUCED POSITION
Sizing is volatility-based: MCD trades at roughly 23% annualized options-implied volatility versus about 13% for the S&P 500 (1.8x the market), around the 92nd percentile of its own trailing year. A 2% - 4% position keeps a single-name swing of that size within a diversified portfolio's risk budget.
Diversification Alternatives
SBUX - Starbucks
Premium Consumer ExposureStarbucks offers access to a higher-income consumer, with recent U.S. comparable sales growth of 7.9% significantly outpacing McDonald's.
YUM - Yum Brands
Diversified QSR PortfolioYum Brands provides exposure to different QSR categories like chicken and pizza, with a similarly high-margin, franchise-heavy model but faster recent revenue growth of 10.3%.
A high-margin real estate and brand-licensing company that uses a restaurant operating system to generate stable, long-term, sales-based rents and royalties.
McDonald's is a mature, cash-generative business facing a near-term execution crisis in its core U.S. market. While international segments provide stability, the U.S. has slowed significantly due to inconsistent value offerings and operational missteps. The company has appointed a new U.S. President and launched a new 'McDonald's > NEXT' strategy to address these issues, focusing on improving food quality, the customer experience, and restaurant efficiency. The investment thesis hinges on whether this new leadership and strategy can quickly fix the U.S. execution problems and reignite traffic growth in a challenging consumer environment.
Reports of accelerating U.S. comparable sales and positive guest count trends in subsequent quarters. Evidence of successful execution of the 'McDonald's > NEXT' strategy, such as improved customer satisfaction scores. Continued strong performance and market share gains in international markets.
Continued negative U.S. guest count trends and below-expectation comparable sales. Reports of franchisee discontent or poor execution of new value or menu initiatives. A significant slowdown in international markets, particularly in key IOM countries.
Short-term commodity price fluctuations. Individual marketing campaigns that are not part of a broader strategic push. Naming rights deals for stadiums opening in 2028.
Repricing Catalyst
The market is focused on the U.S. segment's ability to recover from its Q2 2026 underperformance. The performance in Q3 and Q4 2026 under new U.S. leadership and initial strategic adjustments will be a key catalyst for repricing the stock.
United States (US)
$10.9B TTM (40% of Total) · 53% MarginWhat It Is
This segment's revenues consist of sales from company-operated restaurants directly to consumers, and rent and royalty fees collected from franchisees operating in the U.S.
Who Pays & How
Consumers pay for food and beverages. Franchisees pay rent and royalties to leverage the McDonald's brand, operational systems, and real estate, which the company often owns or leases long-term.
Competition
International Operated Markets
$14.0B TTM (51% of Total) · 47% MarginWhat It Is
This segment's revenues consist of sales from company-operated restaurants and fees from franchisees in established international markets like Australia, Canada, France, Germany, and the U.K.
Who Pays & How
Similar to the U.S., revenue comes from both direct consumer sales and fees from franchisees. Franchisees pay to operate under the globally recognized McDonald's brand with established operational support.
Competition
International Developmental Licensed Markets & Corporate
$2.5B TTM (9% of Total) · 9% MarginWhat It Is
This segment's revenues are primarily from royalties and fees from developmental licensees and affiliates in over 75 countries, including markets like China and Japan. Under this model, the licensee provides capital for the entire business, including real estate.
Who Pays & How
Developmental licensees and affiliates pay royalties and fees to McDonald's. They do this to gain the rights to operate and expand the McDonald's brand in their markets, shouldering the capital investment in exchange for leveraging a proven global brand and system.
Competition
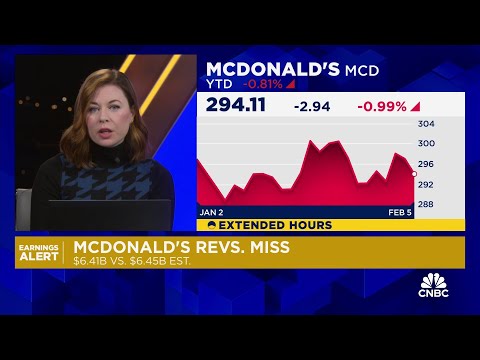
McDonald's — Investor Video Playlist



Industry Resources
| Consumer Discretionary Resources |
| Retail Dive |
| Business of Fashion (BoF) |
| WWD (Women's Wear Daily) |
| National Retail Federation (NRF) |
| McKinsey & Company - Consumer |
| Mintel Consumer Trends |
| Restaurants Resources |
| Nation's Restaurant News |
| Restaurant Business |
| QSR Magazine |
External Quote Links
| Y Finance | Barrons |
| TradingView | Morningstar |
| SeekingAlpha | ValueLine |
| Motley Fool | Robinhood |
| CNBC | Etrade |
| MarketWatch | Unusual Whales |
| YCharts | Perplexity Finance |
| FinViz |
Prefer one of these to Trefis? Tell us why.