How To Trade UPST Stock Ahead of Its Earnings?

Upstart (NASDAQ:UPST) is set to report its earnings on Tuesday, May 6, 2025. Historically, UPST stock has demonstrated significant volatility around its earnings releases. Since 2021, the stock has experienced a positive one-day return in 53% of instances. When positive, these returns have been substantial, with a median of 34.6% and a maximum of 89.3% recorded in March 2021.
For event-driven traders, understanding these historical patterns could offer a potential edge, though much will depend on how the actual results compare to consensus estimates and market expectations. There are two primary approaches to leverage this:
- Pre-Earnings Positioning: Analyze historical probabilities of positive returns and establish a position before the earnings announcement.
- Post-Earnings Correlation Analysis: Examine the historical correlation between immediate and medium-term stock performance following earnings releases and position accordingly after the announcement.
Ahead of the upcoming earnings, consensus estimates project earnings per share (EPS) of $0.17 on revenue of $201 million. This represents substantial year-over-year growth compared to the prior period, where Upstart reported a loss of $0.31 per share on revenue of $128 million.
From a fundamental perspective, Upstart currently has a market capitalization of $4.4 billion. Over the trailing twelve months, the company generated $629 million in revenue but reported a net loss of $129 million.
- How Will Constellation Brands Stock React To Its Upcoming Earnings?
- NVIDIA Stock Near Crucial Support – Buy Signal?
- Why FSLR Could Outperform NXP Semiconductors Stock
- Bloom Energy Stock Is On Sale, But Is It Still Too Expensive?
- Broadcom Stock’s AI Calm Hides Its Crash History
- The Real Downturn Risk In ON Semiconductor Stock
That said, if you seek upside with lower volatility than individual stocks, the Trefis High Quality portfolio presents an alternative – having outperformed the S&P 500 and generated returns exceeding 91% since its inception.
See earnings reaction history of all stocks

Image by Tomek from Pixabay
Upstart’s Historical Odds Of Positive Post-Earnings Return
Some observations on one-day (1D) post-earnings returns:
- There are 17 earnings data points recorded over the last five years, with 9 positive and 8 negative one-day (1D) returns observed. In summary, positive 1D returns were seen about 53% of the time.
- However, this percentage decreases to 42% if we consider data for the last 3 years instead of 5.
- Median of the 9 positive returns = 35%, and median of the 8 negative returns = -19%
Additional data for observed 5-Day (5D), and 21-Day (21D) returns post earnings are summarized along with the statistics in the table below.
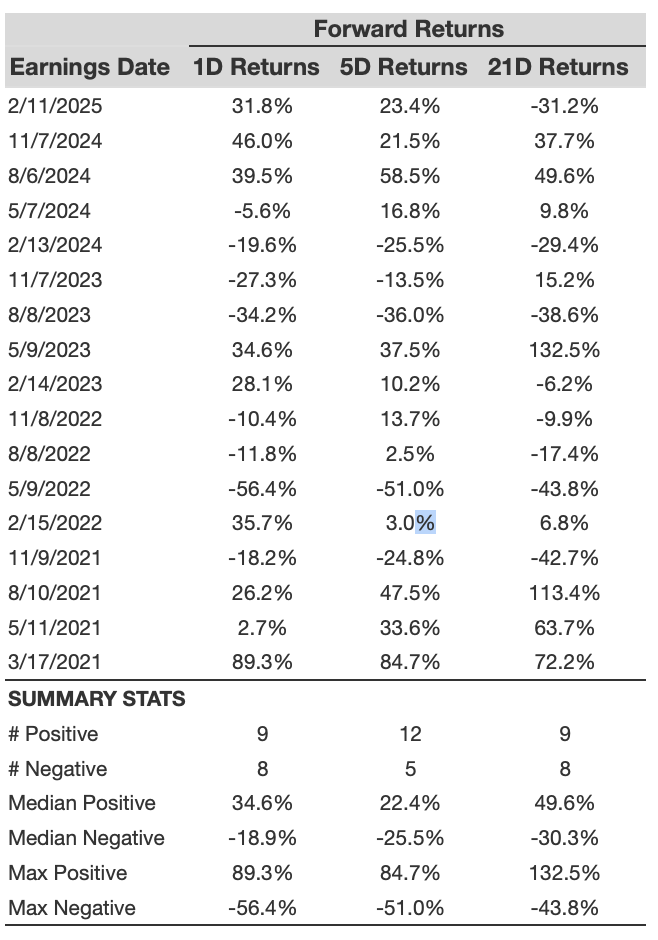
UPST 1D, 5D, and 21D Post Earnings Return
Correlation Between 1D, 5D, and 21D Historical Returns
A relatively less risky strategy (though not useful if the correlation is low) is to understand the correlation between short-term and medium-term returns post earnings, find a pair that has the highest correlation, and execute the appropriate trade. For example, if 1D and 5D show the highest correlation, a trader can position themselves “long” for the next 5 days if 1D post-earnings return is positive. Here is some correlation data based on 5-year and 3-year (more recent) history. Note that the correlation 1D_5D refers to the correlation between 1D post-earnings returns and subsequent 5D returns.
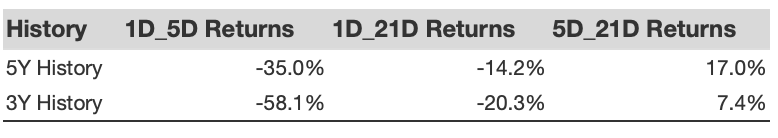
UPST Correlation Between 1D, 5D and 21D Historical Returns
Is There Any Correlation With Peer Earnings?
Sometimes, peer performance can have influence on post-earnings stock reaction. In fact, the pricing-in might begin before the earnings are announced. Here is some historical data on the past post-earnings performance of Upstart stock compared with the stock performance of peers that reported earnings just before Upstart. For fair comparison, peer stock returns also represent post-earnings one-day (1D) returns.
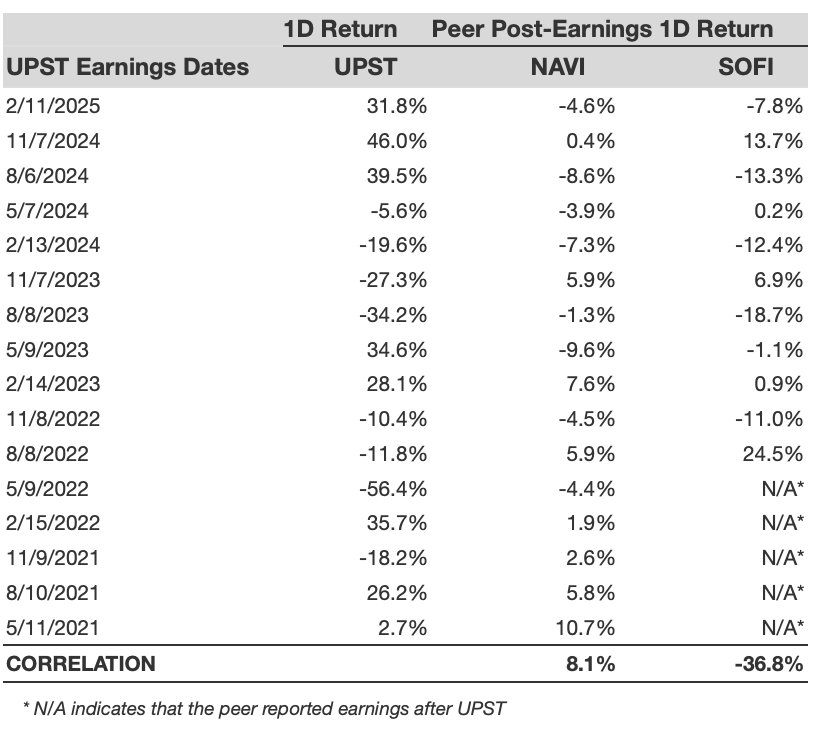
UPST Correlation With Peer Earnings
Learn more about Trefis RV strategy that has outperformed its all-cap stocks benchmark (combination of all 3, the S&P 500, S&P mid-cap, and Russell 2000), to produce strong returns for investors. Separately, if you want upside with a smoother ride than an individual stock like Upstart, consider the High Quality portfolio, which has outperformed the S&P, and clocked >91% returns since inception.
Invest with Trefis Market-Beating Portfolios
See all Trefis Price Estimates