How Will Ubiquiti Stock React To Its Upcoming Earnings?

Ubiquiti (NYSE:UI) is set to report Q4 FY’25 earnings on Friday, August 22, 2025 (June fiscal year). Earnings are projected to come in at about $2.23 per share, up from $1.74 per share in the year-ago quarter, while revenues are likely to stand at about $635 million, up almost 25% compared to last year. Growth is likely to be driven by the Enterprise Technology segment which is seeing higher sales driven by strong demand for upgraded Wi-Fi 6 and 7 networks which offers higher speeds and lower latency. Moreover, enterprises have been spending more on software-defined networking, cloud-based management, and network security and this could also help Ubiquiti.
The company has $24 billion in current market capitalization. Revenue over the last twelve months was $2.3 billion, and it was operationally profitable with $713 million in operating profits and net income of $549 million. While a lot will depend on how results stack up against consensus and expectations, understanding historical patterns might just turn the odds in your favor if you are an event-driven trader.
There are two ways to do that: understand the historical odds and position yourself prior to the earnings release, or look at the correlation between immediate and medium-term returns post earnings and position yourself accordingly after the earnings are released. That said, if you seek upside with lower volatility than individual stocks, the Trefis High Quality portfolio presents an alternative – having outperformed the S&P 500 and generated returns exceeding 91% since its inception.
See earnings reaction history of all stocks
- The Next Big Rally in Ford Motor Stock Could Start Like This
- The Risk Factors to Watch Out For in NVIDIA Stock
- Intuitive Surgical Stock Now 16% Cheaper, Time To Buy
- AT&T Stock Pays Out $85 Bil – Investors Take Note
- Intel Stock Pays Out $92 Bil – Investors Take Note
- Comcast Stock Capital Return Hits $44 Bil
Ubiquiti’s Historical Odds Of Positive Post-Earnings Return
Some observations on one-day (1D) post-earnings returns:
- There are 20 earnings data points recorded over the last five years, with 9 positive and 11 negative one-day (1D) returns observed. In summary, positive 1D returns were seen about 45% of the time.
- However, this percentage decreases to 42% if we consider data for the last 3 years instead of 5.
- Median of the 9 positive returns = 9.8%, and median of the 11 negative returns = -8.6%
Additional data for observed 5-Day (5D) and 21-Day (21D) returns post earnings are summarized along with the statistics in the table below.

UI 1D, 5D, and 21D Post Earnings Return
Correlation Between 1D, 5D, and 21D Historical Returns
A relatively less risky strategy (though not useful if the correlation is low) is to understand the correlation between short-term and medium-term returns post earnings, find a pair that has the highest correlation, and execute the appropriate trade. For example, if 1D and 5D show the highest correlation, a trader can position themselves “long” for the next 5 days if the 1D post-earnings return is positive. Here is some correlation data based on a 5-year and a 3-year (more recent) history. Note that the correlation 1D_5D refers to the correlation between 1D post-earnings returns and subsequent 5D returns.
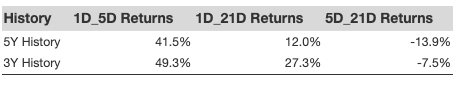
UI Correlation Between 1D, 5D and 21D Historical Returns
Is There Any Correlation With Peer Earnings?
Sometimes, peer performance can have an influence on post-earnings stock reaction. In fact, the pricing-in might begin before the earnings are announced. Here is some historical data on the past post-earnings performance of Ubiquiti stock compared with the stock performance of peers that reported earnings just before Ubiquiti. For fair comparison, peer stock returns also represent post-earnings one-day (1D) returns.
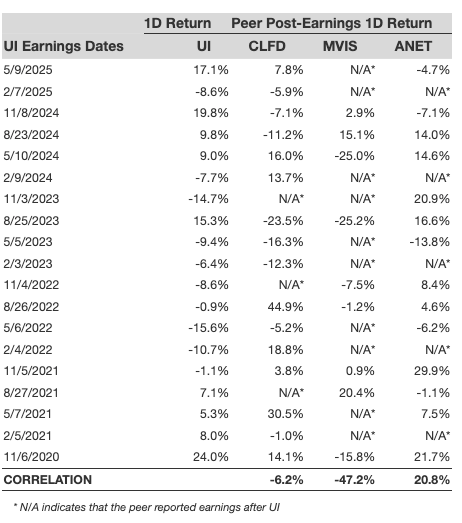
UI Correlation With Peer Earnings
Learn more about Trefis RV strategy that has outperformed its all-cap stocks benchmark (combination of all 3, the S&P 500, S&P mid-cap, and Russell 2000), to produce strong returns for investors. Separately, if you want upside with a smoother ride than an individual stock like Ubiquiti, consider the High Quality portfolio, which has outperformed the S&P and clocked >91% returns since inception.
Invest with Trefis Market-Beating Portfolios
See all Trefis Price Estimates