Buy Tesla Stock Ahead Of Q3 Earnings?

Tesla (NASDAQ:TSLA) is set to report its earnings on Wednesday, October 22, 2025. Earnings are likely to decline to about $0.52 per share, down from $0.72 in the year-ago period, per consensus estimates, while revenues are likely to rise slightly to $25.41 billion. The company recently posted better than expected Q3 delivery numbers, with total shipments rising 7% year-over-year to 462,890 vehicles, driven in part by a rush to buy EVs in the U.S. before the federal tax credit expired in late September. However, Tesla faces ongoing challenges in Europe, where backlash against CEO Elon Musk’s political positions and rising competition from BMW, Volkswagen, and China’s BYD have weighed on its sales.

Image by Dominick Vietor from Pixabay
The company has $1.4 trillion in current market capitalization. Revenue over the last twelve months was $93 Bil, and it was operationally profitable with $5.8 Bil in operating profits and net income of $6.1 Bil. While a lot will depend on how results stack up against consensus and expectations, understanding historical patterns might just turn the odds in your favor if you are an event-driven trader.
There are two ways to do that: understand the historical odds and position yourself prior to the earnings release, or look at the correlation between immediate and medium-term returns post earnings and position yourself accordingly after the earnings are released. That said, if you seek upside with lower volatility than individual stocks, the Trefis High Quality portfolio presents an alternative – having outperformed the S&P 500 and generated returns exceeding 91% since its inception.
- Tesla Stock Traded Its Affordable Car Dream For An AI Moonshot
- The Number That Complicates The Tesla Stock Story
- SpaceX’s Secret Metric
- TSLA Stock: 5 Impending Events That Could Invalidate the Thesis
- Catalysts That Could Propel Tesla Stock to the Moon
- TSLA Stock: 4 Impending Events That Could Invalidate the Thesis
See earnings reaction history of all stocks
Tesla’s Historical Odds Of Positive Post-Earnings Return
Some observations on one-day (1D) post-earnings returns:
- There are 19 earnings data points recorded over the last five years, with 12 positive and 7 negative one-day (1D) returns observed. In summary, positive 1D returns were seen about 63% of the time.
- However, this percentage decreases to 55% if we consider data for the last 3 years instead of 5.
- Median of the 12 positive returns = 4.2%, and median of the 7 negative returns = -6.1%
Additional data for observed 5-Day (5D) and 21-Day (21D) returns post earnings are summarized along with the statistics in the table below.
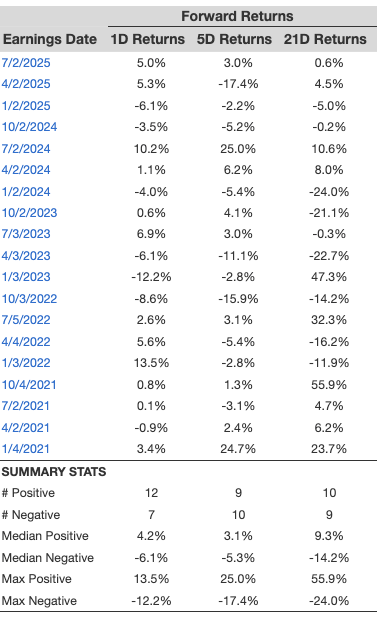
1D, 5D, and 21D Post Earnings Return
Correlation Between 1D, 5D, and 21D Historical Returns
A relatively less risky strategy (though not useful if the correlation is low) is to understand the correlation between short-term and medium-term returns post earnings, find a pair that has the highest correlation, and execute the appropriate trade. For example, if 1D and 5D show the highest correlation, a trader can position themselves “long” for the next 5 days if the 1D post-earnings return is positive. Here is some correlation data based on a 5-year and a 3-year (more recent) history. Note that the correlation 1D_5D refers to the correlation between 1D post-earnings returns and subsequent 5D returns.
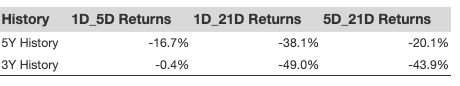
Correlation Between 1D, 5D and 21D Historical Returns
Learn more about Trefis RV strategy that has outperformed its all-cap stocks benchmark (combination of all 3, the S&P 500, S&P mid-cap, and Russell 2000), to produce strong returns for investors. Separately, if you want upside with a smoother ride than an individual stock like Tesla, consider the High Quality portfolio, which has outperformed the S&P and clocked >91% returns since inception. Why is that? As a group, HQ Portfolio stocks provided better returns with less risk versus the benchmark index; less of a roller-coaster ride, as evident in HQ Portfolio performance metrics.
Invest with Trefis Market-Beating Portfolios
See all Trefis Price Estimates