How Will Tesla Stock React To Its Upcoming Earnings?

Tesla (NASDAQ:TSLA) is set to report its earnings on Wednesday, July 23, 2025, reporting on what is expected to be another challenging quarter for the EV behemoth. Earnings are projected to come in at about $0.44 per share, per consensus estimates, down 15% compared to last year, while revenues are projected to fall 11% to 22.7 billion. Tesla has already published its delivery numbers for the quarter, indicating that it shipped 384,122 vehicles in the second quarter, down 13.5% from 443,956 units a year ago. The shortfall underscores the broader challenges Tesla is facing. EV demand is softening in key markets like the U.S., where CEO Elon Musk’s political activity has sparked consumer backlash. Rivals, especially from China, are quickly closing the technology and pricing gap. However, Tesla’s growing energy and services segments, particularly battery storage and services revenue, may help to offset this to some extent. Margins are also expected to remain under pressure. Over Q1 gross margins came in at 16.3%, down from 17.4% a year earlier, and well below the 25% plus levels the company was posting just a few years ago.
Tesla has $946 billion in current market capitalization. Revenue over the last twelve months was $96 billion, and it was operationally profitable, with $7.1 billion in operating profits and net income of $6.4 billion. That said, if you seek upside with lower volatility than individual stocks, the Trefis High Quality portfolio presents an alternative – having outperformed the S&P 500 and generated returns exceeding 91% since its inception.
See earnings reaction history of all stocks
Tesla’s Historical Odds Of Positive Post-Earnings Return
- Can You Stomach Tesla Stock’s Real Drawdowns?
- Tesla’s Missing 10,000: Is Optimus Falling Behind The Robotics Pack?
- Tesla Stock Traded Its Affordable Car Dream For An AI Moonshot
- The Number That Complicates The Tesla Stock Story
- SpaceX’s Secret Metric
- TSLA Stock: 5 Impending Events That Could Invalidate the Thesis
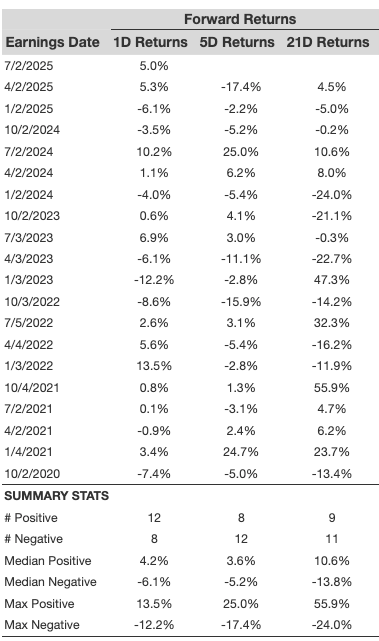
Some observations on one-day (1D) post-earnings returns:
- There are 20 earnings data points recorded over the last five years, with 12 positive and 8 negative one-day (1D) returns observed. In summary, positive 1D returns were seen about 60% of the time.
- However, this percentage decreases to 50% if we consider data for the last 3 years instead of 5.
- Median of the 12 positive returns = 4.2%, and median of the 8 negative returns = -6.1%
Additional data for observed 5-Day (5D), and 21-Day (21D) returns post earnings are summarized along with the statistics in the table below.
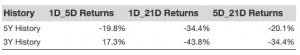
Correlation Between 1D, 5D, and 21D Historical Returns
A relatively less risky strategy (though not useful if the correlation is low) is to understand the correlation between short-term and medium-term returns post earnings, find a pair that has the highest correlation, and execute the appropriate trade. For example, if 1D and 5D show the highest correlation, a trader can position themselves “long” for the next 5 days if 1D post-earnings return is positive. Here is some correlation data based on 5-year and 3-year (more recent) history. Note that the correlation 1D_5D refers to the correlation between 1D post-earnings returns and subsequent 5D returns.
Learn more about Trefis RV strategy that has outperformed its all-cap stocks benchmark (combination of all 3, the S&P 500, S&P mid-cap, and Russell 2000), to produce strong returns for investors. Separately, if you want upside with a smoother ride than an individual stock like Tesla, consider the High Quality portfolio, which has outperformed the S&P, and clocked >91% returns since inception.
Invest with Trefis Market-Beating Portfolios
See all Trefis Price Estimates