Should You Buy or Sell SNAP Stock At $8?

Snapchat’s parent company, Snap (NYSE: SNAP), saw its stock jump 6% in a week. This boost came after the announcement of their new fifth-generation Spectacles and a new operating system, Snap OS 2.0, which includes a major overhaul to the Spectacles Browser for a faster, more powerful, and user-friendly experience, according to the company’s press release.
This recent rise is a welcome break for Snap’s investors, as the stock has dropped 30% this year. Despite the small recovery, the stock still faces challenges, primarily due to its lackluster financial performance.
So, the key question now is – should you buy Snap stock right now at $8? We don’t think it’s a good idea. While Snap’s overall operational and financial performance is moderate, we believe the stock is currently unattractive due to its high valuation. Below is a multi-factor assessment that provides a deeper look into our reasoning.
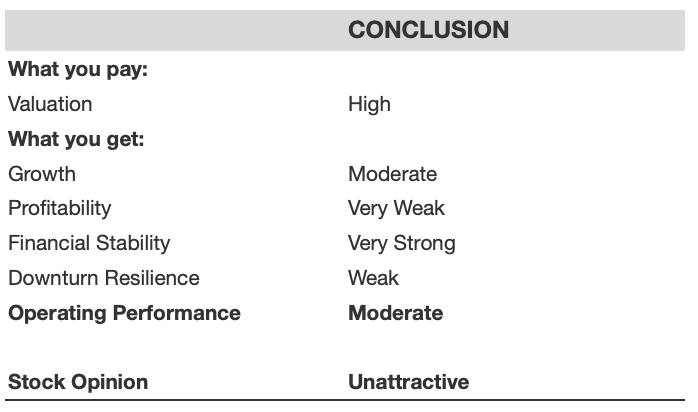
Trefis – SNAP Stock Opinion
But no matter how attractive, investing in a single stock carries high risk. Trefis High Quality Portfolio is designed to reduce stock-specific risk while giving upside exposure.
Let’s get into details of each of the assessed factors but before that, for quick background: With $13 Bil in market cap, Snap provides a camera application with features like communication, Snap Map, Stories, and Spotlight, along with Spectacles eyewear that captures photos and videos from a human perspective.

Pixabay
[1] Valuation Looks High
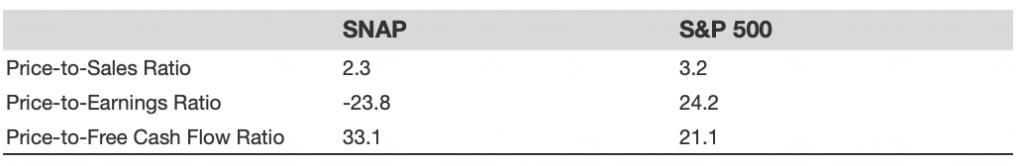
SNAP Valuation
This table highlights how SNAP is valued vs broader market. For more details see: SNAP Valuation Ratios
[2] Growth Is Moderate
- Snap has seen its top line grow at an average rate of 7.7% over the last 3 years
- Its revenues have grown 13% from $5.0 Bil to $5.6 Bil in the last 12 months
- Also, its quarterly revenues grew 8.7% to $1.3 Bil in the most recent quarter from $1.2 Bil a year ago.
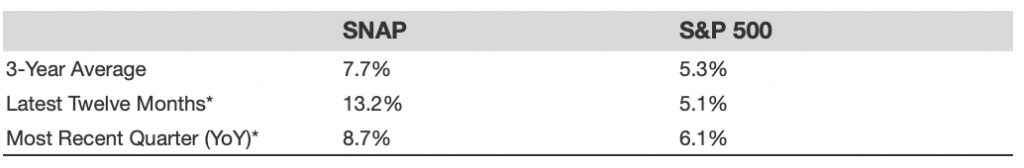
SNAP Revenue Comparison
This table highlights how SNAP is growing vs broader market. For more details see: SNAP Revenue Comparison
[3] Profitability Appears Very Weak
- SNAP last 12 month operating income was $-654 Mil representing operating margin of -11.6%
- With cash flow margin of 10.4%, it generated nearly $587 Mil in operating cash flow over this period
- For the same period, SNAP generated nearly $-546 Mil in net income, suggesting net margin of about -9.7%
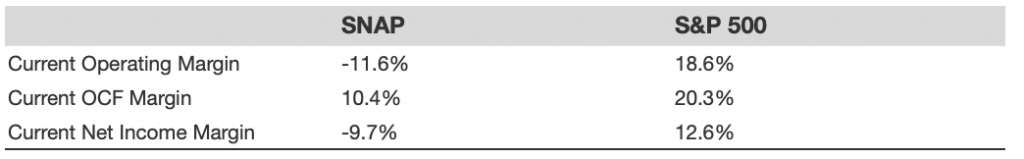
SNAP Profitability
This table highlights how SNAP profitability vs broader market. For more details see: SNAP Operating Income Comparison
[4] Financial Stability Looks Very Strong
- SNAP Debt was $4.2 Bil at the end of the most recent quarter, while its current Market Cap is $13 Bil. This implies Debt-to-Equity Ratio of 32.3%
- SNAP Cash (including cash equivalents) makes up $2.9 Bil of $7.4 Bil in total Assets. This yields a Cash-to-Assets Ratio of 39.1%
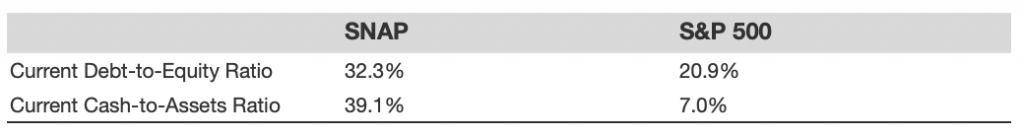
SNAP Financial Stability Check
[5] Downturn Resilience Is Weak
SNAP has fared worse than the S&P 500 index during various economic downturns. We assess this based on both (a) how much the stock fell and, (b) how quickly it recovered.
2022 Inflation Shock
- SNAP stock fell 90.7% from a high of $83.11 on 24 September 2021 to $7.76 on 21 October 2022 vs. a peak-to-trough decline of 25.4% for the S&P 500.
- The stock is yet to recover to its pre-Crisis high
- The highest the stock has reached since then is $17.45 on 6 February 2024 , and currently trades at $7.74
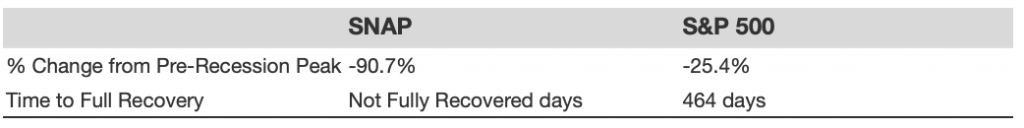
SNAP Performance During 2022 Inflation Shock
2020 COVID-19 Pandemic
- SNAP stock fell 56.5% from a high of $19.25 on 23 January 2020 to $8.37 on 18 March 2020 vs. a peak-to-trough decline of 33.9% for the S&P 500.
- However, the stock fully recovered to its pre-Crisis peak by 1 June 2020
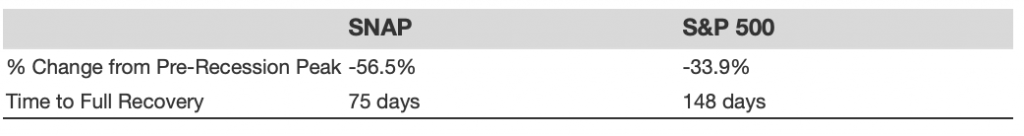
SNAP Performance During The 2020 COVID-19 Pandemic
But the risk is not limited to major market crashes. Stocks fall even when markets are good – think events like earnings, business updates, outlook changes. Read SNAP Dip Buyer Analyses to see how the stock has recovered from sharp dips in the past.
The Trefis High Quality (HQ) Portfolio, with a collection of 30 stocks, has a track record of comfortably outperforming its benchmark that includes all 3 – S&P 500, Russell, and S&P midcap. Why is that? As a group, HQ Portfolio stocks provided better returns with less risk versus the benchmark index; less of a roller-coaster ride, as evident in HQ Portfolio performance metrics.
Invest with Trefis Market-Beating Portfolios
See all Trefis Price Estimates