Can Phillips 66 Defy the Odds This Earnings Season?

Phillips 66 (NYSE: PSX) is set to report its fiscal second-quarter earnings on Friday, July 25, 2025. Analysts predict the company will report earnings of $1.75 per share on $32.1 billion in sales. This would represent a 26% decline in earnings and a 16% decline in sales compared to the previous year’s figures of $2.38 per share and $38.1 billion, respectively. Historical data shows that the stock has declined 63% of the time in the one day following earnings announcements, with a median drop of 2.5% and maximum one-day negative returns reaching 6%. Separately, see What’s Happening With Ericsson Stock?
In Q1, PSX reported $487 million net earnings, up from $8 million in Q4, with refining unit losses offset by strong midstream, chemical, and marketing performance. Management plans to run refineries at around mid-90% capacity in Q2, aiming for operational efficiency. The company continues to optimize its asset portfolio, including its recent sustainability report, and remains focused on reducing greenhouse gas emissions and improving safety. The company has $51 Bil in current market capitalization. Revenue over the last twelve months was $138 Bil, and it was operationally profitable with $604 Mil in operating profits and net income of $1.9 Bil. While a lot will depend on how results stack up against consensus and expectations, understanding historical patterns might turn the odds in your favor if you are an event-driven trader.
There are two ways to do that: understand the historical odds and position yourself before the earnings release, or look at the correlation between immediate and medium-term returns post-earnings and position yourself accordingly after the earnings are released. That said, if you seek upside with lower volatility than individual stocks, the Trefis High Quality portfolio presents an alternative, having outperformed the S&P 500 and generated returns exceeding 91% since its inception. See earnings reaction history of all stocks.

- Microsoft Stock: Is The 15% Drop A Buying Opportunity Or A Warning Sign?
- Adobe Stock Sell-Off: What Happened And Does It Matter?
- What’s Happening With Block Stock?
- When Oil Moves, Bitcoin Bleeds
- This Strategy Pays You 12% While Lining Up PYPL at Bargain Prices
- The Next Big Rally in Microsoft Stock Could Start Like This
Phillips 66’s Historical Odds Of Positive Post-Earnings Return
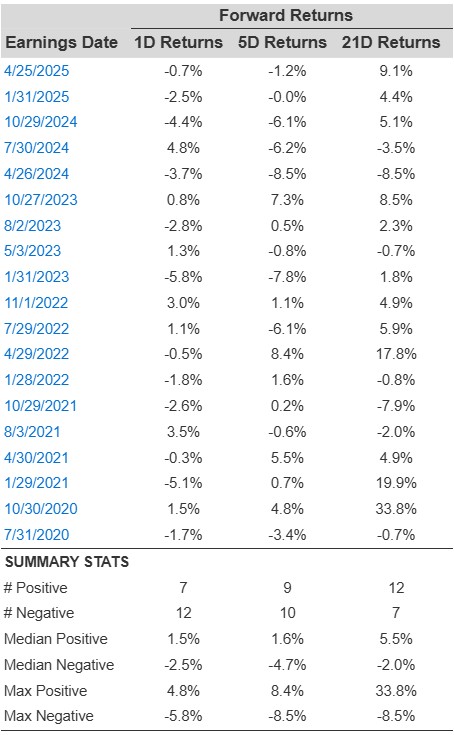
Some observations on one-day (1D) post-earnings returns:
- There are 19 earnings data points recorded over the last five years, with 7 positive and 12 negative one-day (1D) returns observed. In summary, positive 1D returns were seen about 37% of the time.
- Notably, this percentage increases to 45% if we consider data for the last 3 years instead of 5.
- Median of the 7 positive returns = 1.5%, and median of the 12 negative returns = -2.5%
Additional data for observed 5-Day (5D) and 21-Day (21D) returns post-earnings are summarized, along with the statistics, in the table below.
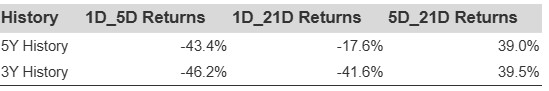
Correlation Between 1D, 5D, and 21D Historical Returns
A relatively less risky strategy (though not useful if the correlation is low) is to understand the correlation between short-term and medium-term returns post earnings, find a pair that has the highest correlation, and execute the appropriate trade. For example, if 1D and 5D show the highest correlation, a trader can position themselves “long” for the next 5 days if 1D post-earnings return is positive. Here is some correlation data based on 5-year and 3-year (more recent) history. Note that the correlation 1D_5D refers to the correlation between 1D post-earnings returns and subsequent 5D returns.
Learn more about Trefis RV strategy that has outperformed its all-cap stocks benchmark (combination of all 3, the S&P 500, S&P mid-cap, and Russell 2000), to produce strong returns for investors.
Invest with Trefis Market-Beating Portfolios