Buy or Sell Philip Morris Stock Ahead of Its Upcoming Earnings?

Philip Morris International (NYSE: PM) is scheduled to announce its earnings on Tuesday, October 21, 2025. Analyzing the past five years of data, Philip Morris stock has exhibited positive one-day returns following earnings reports in 55% of instances. The median positive return observed was 2.5%, with the highest one-day positive return reaching 10.9%.
For event-driven traders, while actual results relative to consensus and expectations are paramount, understanding these historical patterns can provide a strategic advantage. Two primary approaches can be employed:
- Pre-earnings positioning: Assess the historical probabilities and establish a position before the earnings announcement.
- Post-earnings positioning: Evaluate the correlation between immediate and medium-term returns after the earnings release to inform trading decisions.
Analysts anticipate Philip Morris to report earnings of $2.10 per share on sales of $10.66 billion. These estimates are higher than the year-ago quarter’s results, which saw earnings of $1.91 per share on sales of $9.91 billion.
From a fundamental standpoint, the company currently holds a market capitalization of $243 billion. Over the last twelve months, Philip Morris generated $39 billion in revenue, achieving $14 billion in operating profits and a net income of $8.2 billion.
- Is Philip Morris International Stock Undervalued Stock Or Value Trap?
- Is Philip Morris International Stock A Trap Or A Missed Opportunity?
- Is Philip Morris International Stock Poised for a Rally?
- Is Wall Street Underestimating Philip Morris International Stock’s Potential?
- Philip Morris International Stock Pulls Back to Support – Smart Entry?
- Philip Morris International Stock Hands $49 Bil Back – Worth a Look?
That being said, if you seek an upside with less volatility than holding an individual stock, consider the High Quality Portfolio. It has comfortably outperformed its benchmark—a combination of the S&P 500, Russell, and S&P MidCap indexes—and has achieved returns exceeding 105% since its inception. Why is that? As a group, HQ Portfolio stocks provided better returns with less risk versus the benchmark index; less of a roller-coaster ride, as evident in HQ Portfolio performance metrics.
See earnings reaction history of all stocks

Image by Žarko Lazarević from Pixabay
Philip Morris International’s Historical Odds Of Positive Post-Earnings Return
Some observations on one-day (1D) post-earnings returns:
- There are 20 earnings data points recorded over the last five years, with 11 positive and 9 negative one-day (1D) returns observed. In summary, positive 1D returns were seen about 55% of the time.
- However, this percentage decreases to 50% if we consider data for the last 3 years instead of 5.
- Median of the 11 positive returns = 2.5%, and median of the 9 negative returns = -2.7%
Additional data for observed 5-Day (5D), and 21-Day (21D) returns post earnings are summarized along with the statistics in the table below.
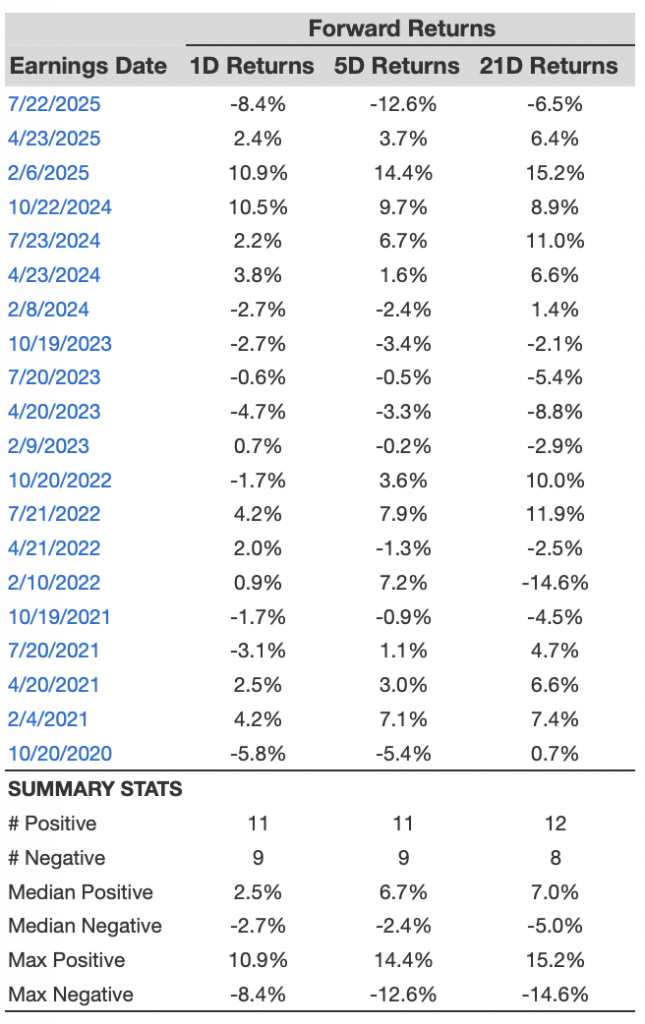
PM 1D, 5D, and 21D Post Earnings Return
Correlation Between 1D, 5D, and 21D Historical Returns
A relatively less risky strategy (though not useful if the correlation is low) is to understand the correlation between short-term and medium-term returns post earnings, find a pair that has the highest correlation, and execute the appropriate trade. For example, if 1D and 5D show the highest correlation, a trader can position themselves “long” for the next 5 days if the 1D post-earnings return is positive. Here is some correlation data based on a 5-year and a 3-year (more recent) history. Note that the correlation 1D_5D refers to the correlation between 1D post-earnings returns and subsequent 5D returns.
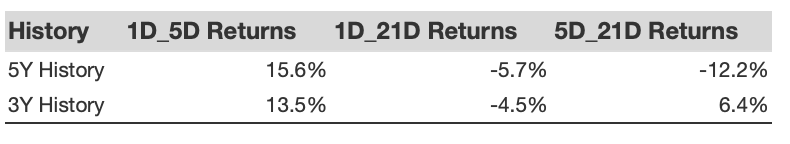
Correlation Between 1D, 5D, and 21D Historical Returns
Investing in a single stock without comprehensive analysis can be risky. Consider the Trefis Reinforced Value (RV) Portfolio, which has outperformed its all-cap stocks benchmark (combination of the S&P 500, S&P mid-cap, and Russell 2000 benchmark indices) to produce strong returns for investors. Why is that? The quarterly rebalanced mix of large-, mid-, and small-cap RV Portfolio stocks provided a responsive way to make the most of upbeat market conditions while limiting losses when markets head south, as detailed in RV Portfolio performance metrics.
Invest with Trefis Market-Beating Portfolios
See all Trefis Price Estimates