How Will Philip Morris Stock React To Its Upcoming Earnings?

Philip Morris International (NYSE:PM) is scheduled to announce its earnings on Tuesday, July 22, 2025. Analyzing the past five years of data, Philip Morris stock has exhibited positive one-day returns following earnings reports in 60% of instances. The median positive return observed was 3.2%, with the highest one-day positive return reaching 10.9%.
For event-driven traders, while actual results relative to consensus and expectations are paramount, understanding these historical patterns can provide a strategic advantage. Two primary approaches can be employed:
- Pre-earnings positioning: Assess the historical probabilities and establish a position before the earnings announcement.
- Post-earnings positioning: Evaluate the correlation between immediate and medium-term returns after the earnings release to inform trading decisions.
Analysts anticipate Philip Morris to report earnings of $1.86 per share on sales of $10.33 billion. These estimates are higher than the year-ago quarter’s results, which saw earnings of $1.59 per share on sales of $9.47 billion.
From a fundamental standpoint, the company currently holds a market capitalization of $285 billion. Over the last twelve months, Philip Morris generated $38 billion in revenue, achieving $14 billion in operating profits and a net income of $7.6 billion.
- A Decade of Rewards: $75 Bil From Philip Morris International Stock
- Ten-Year Tally: Philip Morris International Stock Delivers $75 Bil Gain
- Buy or Sell Philip Morris Stock Ahead of Its Upcoming Earnings?
- PM Has Returned $74 Bil To Shareholders In A Decade
- PM Has Paid Out $74 Bil to Investors in the Past Decade
- PM Stock Up 5.6% after 5-Day Win Streak
That said, if you seek upside with lower volatility than individual stocks, the Trefis High Quality portfolio presents an alternative — having outperformed the S&P 500 and generated returns exceeding 91% since its inception. Separately, see – RCAT Stock To $25?
See earnings reaction history of all stocks

Image by Žarko Lazarević from Pixabay
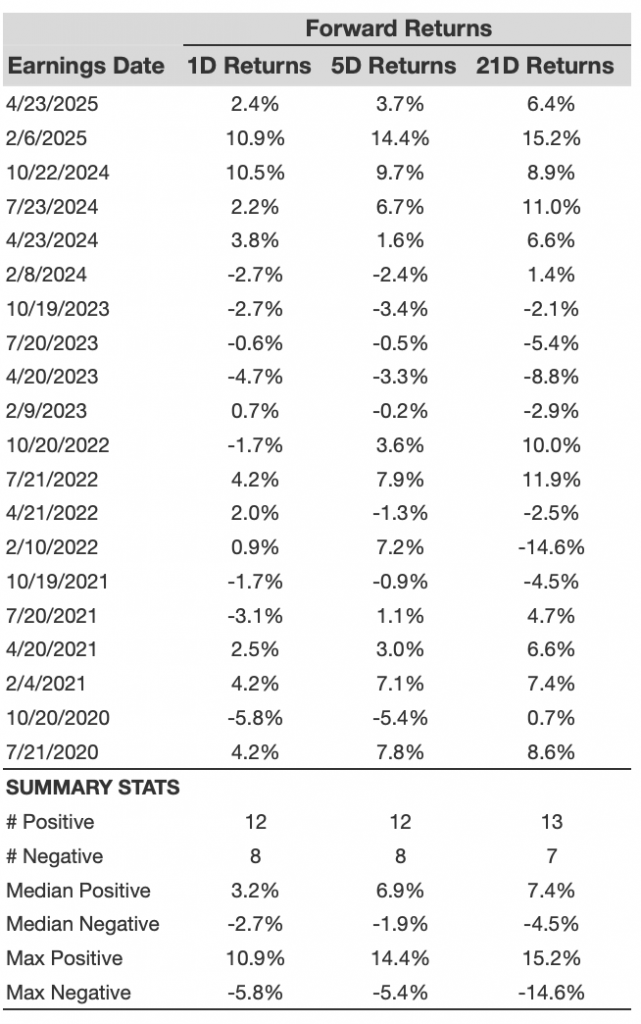
Philip Morris International’s Historical Odds Of Positive Post-Earnings Return
Some observations on one-day (1D) post-earnings returns:
- There are 20 earnings data points recorded over the last five years, with 12 positive and 8 negative one-day (1D) returns observed. In summary, positive 1D returns were seen about 60% of the time.
- However, this percentage decreases to 58% if we consider data for the last 3 years instead of 5.
- Median of the 12 positive returns = 3.2%, and median of the 8 negative returns = -2.7%
Additional data for observed 5-Day (5D), and 21-Day (21D) returns post earnings are summarized along with the statistics in the table below.
Correlation Between 1D, 5D, and 21D Historical Returns
A relatively less risky strategy (though not useful if the correlation is low) is to understand the correlation between short-term and medium-term returns post earnings, find a pair that has the highest correlation, and execute the appropriate trade. For example, if 1D and 5D show the highest correlation, a trader can position themselves “long” for the next 5 days if 1D post-earnings return is positive. Here is some correlation data based on 5-year and 3-year (more recent) history. Note that the correlation 1D_5D refers to the correlation between 1D post-earnings returns and subsequent 5D returns.

LMT Correlation Between 1D, 5D and 21D Historical Returns
Learn more about Trefis RV strategy that has outperformed its all-cap stocks benchmark (combination of all 3, the S&P 500, S&P mid-cap, and Russell 2000), to produce strong returns for investors. Separately, if you want upside with a smoother ride than an individual stock like Philip Morris International, consider the High Quality portfolio, which has outperformed the S&P, and clocked >91% returns since inception.
Invest with Trefis Market-Beating Portfolios
See all Trefis Price Estimates