Buy or Sell Plug Power Stock Ahead of Its Upcoming Earnings?

Plug Power (NASDAQ: PLUG), a hydrogen fuel cell company, is scheduled to release its earnings on Monday, August 11, 2025. Based on historical data, the stock has a higher chance of a negative one-day reaction. Over the past five years, PLUG has experienced a one-day decline following earnings in 61% of instances, with a median loss of -5.9% and a maximum one-day drop of -40.5%. This highlights the stock’s significant volatility around its earnings reports.
For event-driven traders, understanding these historical patterns can provide an edge, although the actual results versus consensus expectations will be the primary driver. There are two potential strategies to consider:
- Pre-Earnings Positioning: Analyze the historical probabilities and take a position before the earnings report is public.
- Post-Earnings Positioning: Examine the correlation between immediate and medium-term returns after the announcement to guide your decisions.
Consensus estimates project a notable improvement in the company’s performance for this quarter. Analysts expect revenue to be $158 million and an adjusted loss of $0.16 per share, which compares favorably to the previous year’s quarter, where revenue was $143 million and the adjusted loss was $0.34 per share.
From a fundamental perspective, the company has a current market capitalization of $1.4 billion. Over the last twelve months, Plug Power generated $642 million in revenue but was operationally loss-making, with operating losses of -$988 million and a net loss of -$2.0 billion.
- Palantir At 80x Earnings: What Revenue Growth Rate Justifies The Valuation?
- Should You Pay Attention To Chevron Stock’s Momentum?
- What Is Happening With Caterpillar Stock?
- What Can Trigger Microsoft Stock’s Slide?
- Is Microsoft Stock A Trap Or A Missed Opportunity?
- Earn 9.6% Today or Buy BSX 30% Cheaper – It’s a Win-Win
That said, if you seek upside with lower volatility than individual stocks, the Trefis High Quality portfolio presents an alternative — having outperformed the S&P 500 and generated returns exceeding 91% since its inception. Separately, see – What’s Happening With JOBY Stock?
See earnings reaction history of all stocks

Image by Erich Westendarp from Pixabay
Plug Power’s Historical Odds Of Positive Post-Earnings Return
Some observations on one-day (1D) post-earnings returns:
- There are 18 earnings data points recorded over the last five years, with 7 positive and 11 negative one-day (1D) returns observed. In summary, positive 1D returns were seen about 39% of the time.
- However, this percentage decreases to 36% if we consider data for the last 3 years instead of 5.
- Median of the 7 positive returns = 10%, and median of the 11 negative returns = -5.9%
Additional data for observed 5-Day (5D) and 21-Day (21D) returns post earnings are summarized along with the statistics in the table below. Related – Plug Power’s Hydrogen Hopes Dashed?
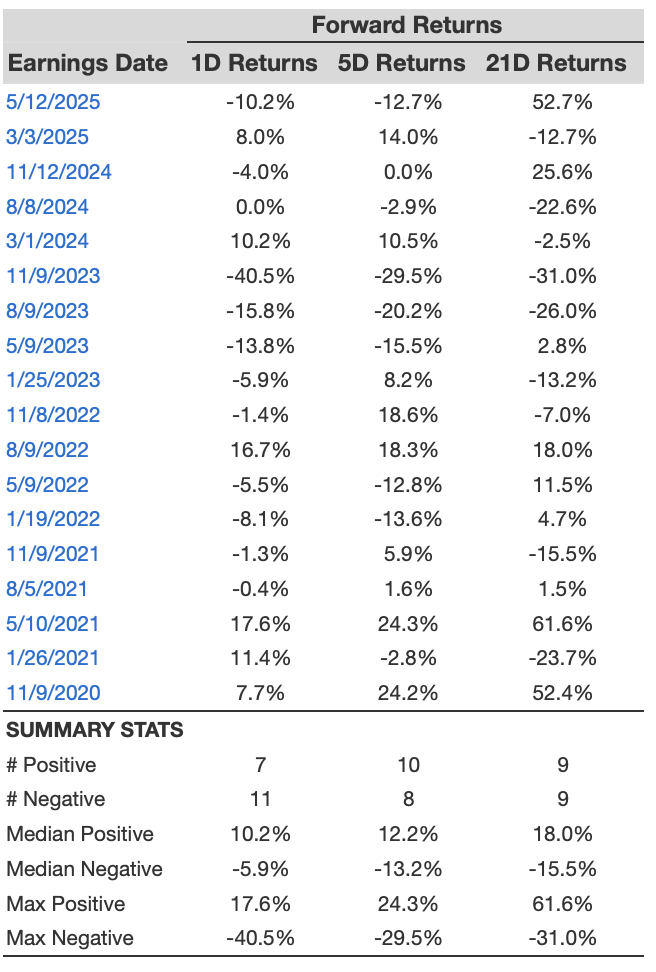
PLUG 1D, 5D, and 21D Post Earnings Return
Correlation Between 1D, 5D, and 21D Historical Returns
A relatively less risky strategy (though not useful if the correlation is low) is to understand the correlation between short-term and medium-term returns post earnings, find a pair that has the highest correlation, and execute the appropriate trade. For example, if 1D and 5D show the highest correlation, a trader can position themselves “long” for the next 5 days if the 1D post-earnings return is positive. Here is some correlation data based on a 5-year and a 3-year (more recent) history. Note that the correlation 1D_5D refers to the correlation between 1D post-earnings returns and subsequent 5D returns. Also, see – Buy or Sell PLUG Stock?
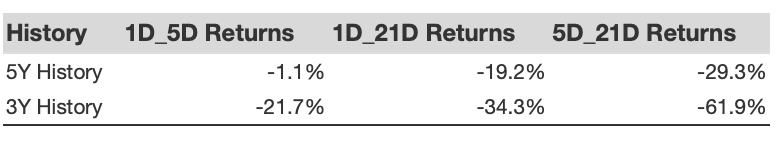
Correlation Between 1D, 5D and 21D Historical Returns
Is There Any Correlation With Peer Earnings?
Sometimes, peer performance can have an influence on post-earnings stock reaction. In fact, the pricing-in might begin before the earnings are announced. Here is some historical data on the past post-earnings performance of Plug Power stock compared with the stock performance of peers that reported earnings just before Plug Power. For fair comparison, peer stock returns also represent post-earnings one-day (1D) returns.
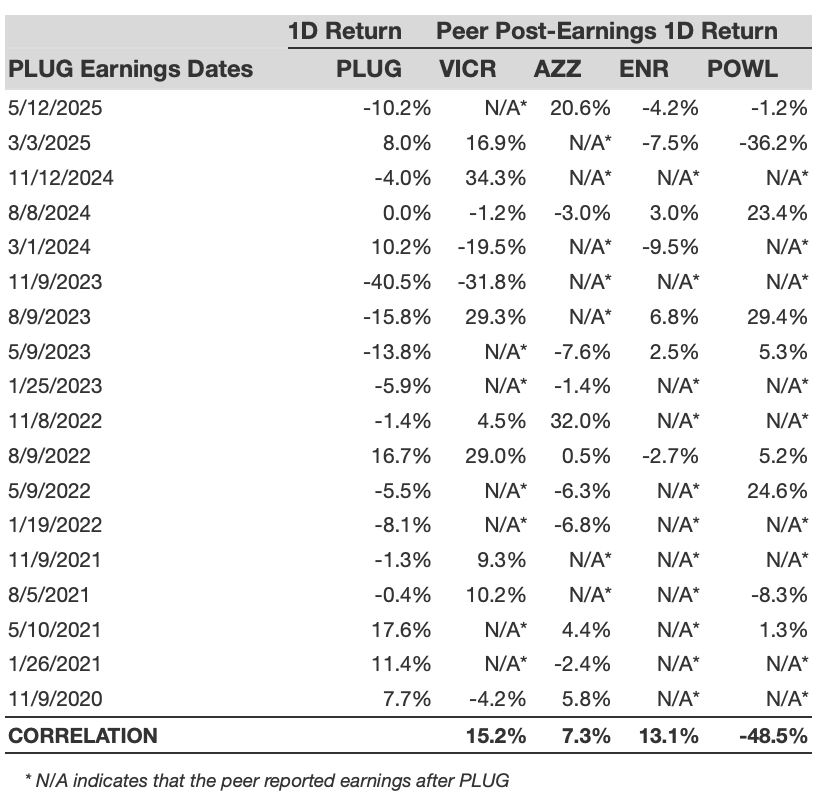
PLUG Correlation With Peer Earnings
Learn more about Trefis RV strategy that has outperformed its all-cap stocks benchmark (combination of all 3, the S&P 500, S&P mid-cap, and Russell 2000), to produce strong returns for investors. Separately, if you want upside with a smoother ride than an individual stock like Plug Power, consider the High Quality portfolio, which has outperformed the S&P and clocked >91% returns since inception.
Invest with Trefis Market-Beating Portfolios
See all Trefis Price Estimates