How Will Palantir Technologies Stock React To Its Upcoming Earnings?

Palantir Technologies (NASDAQ:PLTR) is set to report its Q2 FY’25 earnings on Monday, August 4. Consensus estimates project earnings of $0.14 per share, up from $0.09 a year ago, with revenue expected to rise 38% year-over-year to $939 million. Growth is being fueled by strong demand for Palantir’s AI and big data platforms, particularly in the U.S. Over Q1, U.S. commercial revenue surged 71%, while government revenue was up 45% to $373 million. Profitability has also remained robust, with adjusted operating margins standing at 44% over the last quarter.
Palantir currently has a market capitalization of $373 billion, with trailing 12-month revenues of $3.1 billion, operating income of $406 million, and net income of $571 million. However, the stock trades at lofty valuation multiples – its forward P/E is about 270x – making it especially sensitive to earnings surprises and forward guidance. So how is the stock likely to react to earnings? While a lot will depend on how results stack up against consensus and expectations, understanding historical patterns might just turn the odds in your favor if you are an event-driven trader.
There are two ways to do that: understand the historical odds and position yourself prior to the earnings release, or look at the correlation between immediate and medium-term returns post earnings and position yourself accordingly after the earnings are released. That said, if you seek upside with lower volatility than individual stocks, the Trefis High Quality portfolio presents an alternative – having outperformed the S&P 500 and generated returns exceeding 91% since its inception.
See earnings reaction history of all stocks
- The Next Big Rally in Ford Motor Stock Could Start Like This
- The Risk Factors to Watch Out For in NVIDIA Stock
- Intuitive Surgical Stock Now 16% Cheaper, Time To Buy
- AT&T Stock Pays Out $85 Bil – Investors Take Note
- Intel Stock Pays Out $92 Bil – Investors Take Note
- Comcast Stock Capital Return Hits $44 Bil
Palantir Technologies’ Historical Odds Of Positive Post-Earnings Return
Some observations on one-day (1D) post-earnings returns:
- There are 19 earnings data points recorded over the last five years, with 10 positive and 9 negative one-day (1D) returns observed. In summary, positive 1D returns were seen about 53% of the time.
- Notably, this percentage increases to 58% if we consider data for the last 3 years instead of 5.
- Median of the 10 positive returns = 21%, and median of the 9 negative returns = -13%
Additional data for observed 5-Day (5D), and 21-Day (21D) returns post earnings are summarized along with the statistics in the table below.
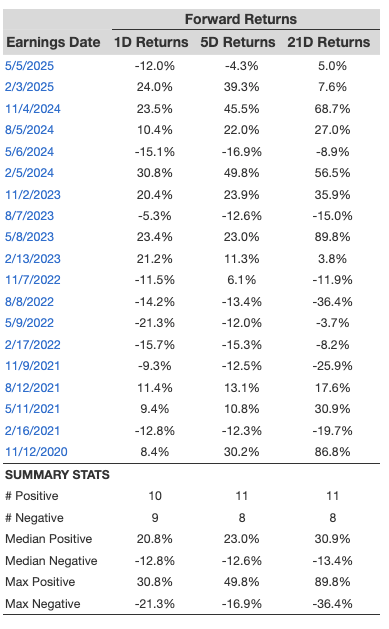
PLTR 1D, 5D, and 21D Post Earnings Return
Correlation Between 1D, 5D, and 21D Historical Returns
A relatively less risky strategy (though not useful if the correlation is low) is to understand the correlation between short-term and medium-term returns post earnings, find a pair that has the highest correlation, and execute the appropriate trade. For example, if 1D and 5D show the highest correlation, a trader can position themselves “long” for the next 5 days if 1D post-earnings return is positive. Here is some correlation data based on 5-year and 3-year (more recent) history. Note that the correlation 1D_5D refers to the correlation between 1D post-earnings returns and subsequent 5D returns.
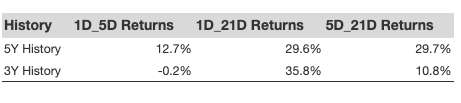
PLTR Correlation Between 1D, 5D and 21D Historical Returns
Learn more about Trefis RV strategy that has outperformed its all-cap stocks benchmark (combination of all 3, the S&P 500, S&P mid-cap, and Russell 2000), to produce strong returns for investors. Separately, if you want upside with a smoother ride than an individual stock like Palantir Technologies, consider the High Quality portfolio, which has outperformed the S&P, and clocked >91% returns since inception.
Invest with Trefis Market-Beating Portfolios
See all Trefis Price Estimates