How Will Procter & Gamble Stock React To Its Upcoming Earnings?

Procter & Gamble (NYSE:PG) is scheduled to announce its earnings on Tuesday, July 29, 2025. Looking at the past five years of data, P&G’s stock has shown a strong tendency for positive one-day returns following earnings announcements, occurring in 70% of instances. The median one-day gain was 2.2%, with the largest single-day increase reaching 4.1%.
While the actual results compared to consensus estimates will be crucial, understanding these historical patterns can provide an advantage for event-driven traders. There are two main approaches to utilize this information:
- Pre-Earnings Positioning: Traders may choose to position themselves before the earnings release, based on the historical probabilities.
- Post-Earnings Analysis: Alternatively, traders can analyze the correlation between immediate and medium-term returns after the earnings are released to inform their positioning.
Analysts’ consensus estimate for the upcoming quarter is earnings of $1.42 per share on sales of $20.85 billion. This is only marginally higher than the year-ago quarter’s earnings of $1.40 per share on sales of $20.53 billion, suggesting expectations for steady, rather than significant, growth.
From a fundamental perspective, Procter & Gamble has a current market capitalization of approximately $372 billion. Over the last twelve months, the company generated $84 billion in revenue, and was operationally profitable with $20 billion in operating profits and a net income of $15 billion.
- Why PG Could Outperform Estee Lauder Companies Stock
- Buy or Sell Procter & Gamble Stock?
- Better Value & Growth: PG Leads Estee Lauder Companies Stock
- Ten-Year Tally: Procter & Gamble Stock Delivers $71 Bil Gain
- PG Tops Estee Lauder Companies Stock on Price & Potential
- Buy or Sell Procter & Gamble Stock?
That said, if you seek upside with lower volatility than individual stocks, the Trefis High Quality portfolio presents an alternative — having outperformed the S&P 500 and generated returns exceeding 91% since its inception.
See earnings reaction history of all stocks

Image by Emilian Robert Vicol from Pixabay
Procter & Gamble’s Historical Odds Of Positive Post-Earnings Return
Some observations on one-day (1D) post-earnings returns:
- There are 20 earnings data points recorded over the last five years, with 14 positive and 6 negative one-day (1D) returns observed. In summary, positive 1D returns were seen about 70% of the time.
- However, this percentage decreases to 67% if we consider data for the last 3 years instead of 5.
- Median of the 14 positive returns = 2.2%, and median of the 6 negative returns = -2.9%
Additional data for observed 5-Day (5D), and 21-Day (21D) returns post earnings are summarized along with the statistics in the table below.
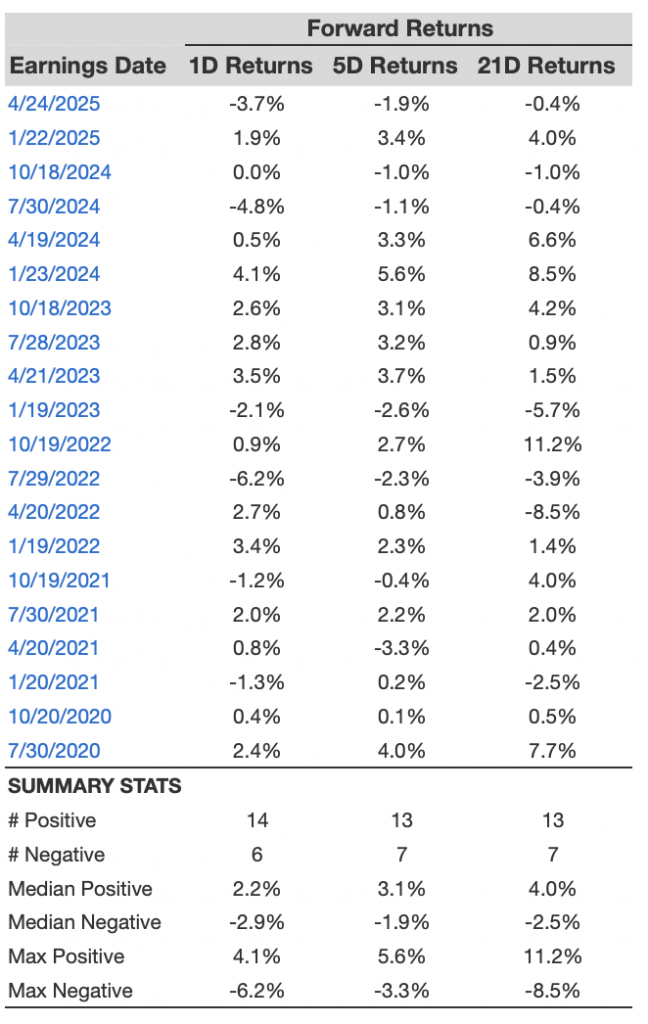
PG 1D, 5D, and 21D Post Earnings Return
Correlation Between 1D, 5D, and 21D Historical Returns
A relatively less risky strategy (though not useful if the correlation is low) is to understand the correlation between short-term and medium-term returns post earnings, find a pair that has the highest correlation, and execute the appropriate trade. For example, if 1D and 5D show the highest correlation, a trader can position themselves “long” for the next 5 days if 1D post-earnings return is positive. Here is some correlation data based on 5-year and 3-year (more recent) history. Note that the correlation 1D_5D refers to the correlation between 1D post-earnings returns and subsequent 5D returns.
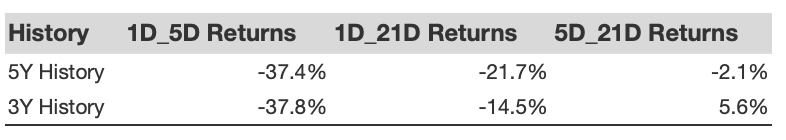
PG Correlation Between 1D, 5D and 21D Historical Returns
Learn more about Trefis RV strategy that has outperformed its all-cap stocks benchmark (combination of all 3, the S&P 500, S&P mid-cap, and Russell 2000), to produce strong returns for investors. Separately, if you want upside with a smoother ride than an individual stock like Procter & Gamble, consider the High Quality portfolio, which has outperformed the S&P, and clocked >91% returns since inception.
Invest with Trefis Market-Beating Portfolios
See all Trefis Price Estimates