Procter & Gamble Stock Unlikely To Cross Pre-Crisis Level Of $124?

Based on a comparison of Procter & Gamble’s stock (NYSE: PG) trajectory over recent months with that around the 2008 recession, we believe that the stock can potentially gain just an additional 3.5% once fears surrounding the coronavirus outbreak subside, to reach $118.
A detailed comparison of Procter & Gamble’s performance with the S&P 500 is available in our interactive dashboard analysis, 2007-08 vs. 2020 Crisis Comparison: How Did Procter & Gamble Stock Fare Compared With S&P 500?
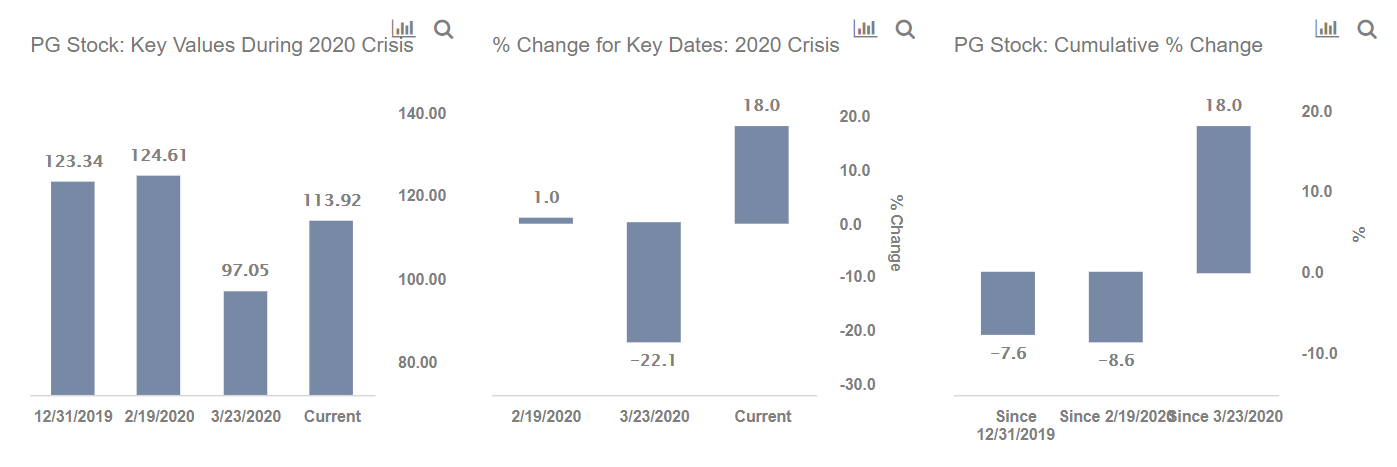
The World Health Organization (WHO) declared a global health emergency at the end of January in light of the coronavirus spread. The rally in the equity market continued till February 19 with the S&P 500 reaching a record high, but the trend reversed sharply over the following weeks. P&G stock lost 22% of its value (vs. about 34% decline in the S&P 500) between February 19 and March 23. A bulk of the decline came after March 6th, when an increasing number of Coronavirus cases outside China fueled concerns of a global economic slowdown. Notably, though, the multi-billion dollar stimulus package announced by the U.S. government has helped the stock price recover 18% over recent weeks (vs. about a 28% gain in the S&P 500) to its current level of $114.
- Is Procter & Gamble Stock Appropriately Priced At $160?
- Should You Pick Procter & Gamble Stock At $155 After A Mixed Q2?
- Is Procter & Gamble Stock Fully Valued At $150?
- Will Procter & Gamble Stock Continue To Rise After 27% Gains In The Ongoing Inflation Shock?
- Should You Buy TMUS Over Procter & Gamble Stock For Better Returns?
- Should You Buy Colgate-Palmolive Stock At $80?
Procter & Gamble’s Stock Fell Because The Situation On The Ground Has Changed
Despite the coronavirus crisis commanding an increased demand for personal care and hygiene products, the lockdown situation in many countries is likely to disrupt manufacturing and supply chain activities, thereby negatively impacting Procter & Gamble’s sales.
We believe Procter & Gamble’s Q4 results will confirm this reality with a drop in revenue across all segments. If signs of coronavirus containment aren’t clear by the Q4 earnings in July, it’s likely that P&G stock, along with the broader market, is going to see another round of sell-offs when results confirm palpable reality.
But P&G Stock Witnessed Something Similar During The 2008 Downturn
We see P&G stock declined from levels of around $49 in October 2007 (the pre-crisis peak) to roughly $34 in March 2009 (as the markets bottomed out) – implying that the stock lost as much as 29% of its value from its approximate pre-crisis peak. This marked a lower drop than the broader S&P, which fell by about 51%.
However, P&G recovered steadily post the 2008 crisis to about $44 in early 2010 – rising by ~29% between March 2009 and January 2010. In comparison, the S&P bounced back by about 48% over the same period.
Will Procter & Gamble’s Stock Recover Similarly From The Current Crisis?
Keeping in mind the fact that P&G stock fell 22% from the market peak on February 19 to the low on March 23 compared to the 29% decline during the 2008 recession, we believe it can potentially recover to just below $120, once economic conditions begin to show signs of improving. This would mark a recovery to within 5% of the pre-crisis peak of around $124, before the coronavirus outbreak gained global momentum.
That said, the actual recovery and its timing hinge on the broader containment of the coronavirus spread. Our dashboard forecasting U.S. COVID-19 cases with cross-country comparisons analyzes expected recovery time-frames and possible spread of the virus.
Further, our dashboard -28% Coronavirus crash vs. 4 Historic crashes builds a complete macro picture and complements our analyses of the coronavirus outbreak’s impact on a diverse set of companies. The complete set of coronavirus impact and timing analyses is available here.
Further, you can see how COVID-19 has affected P&G’s consumer goods peer Kimberly-Clark, in our dashboard 2007-08 vs. 2020 Crisis Comparison: How Did Kimberly-Clark Stock Fare Compared With S&P 500?
See all Trefis Price Estimates and Download Trefis Data here
What’s behind Trefis? See How It’s Powering New Collaboration and What-Ifs For CFOs and Finance Teams | Product, R&D, and Marketing Teams