Here’s A Better Pick Over Procter & Gamble Stock

We believe that Estee Lauder stock (NYSE: EL) is a better pick over its industry peer Procter & Gamble stock (NYSE: PG), given its better prospects. Estee Lauder stock is trading at 5.5x trailing revenues compared to 4.5x for P&G. Investors have assigned a higher valuation multiple to EL stock, given its better financial position, as discussed below.
If we look at stock returns, both stocks have seen around a 5% fall in the last twelve months, in line with the 6% fall for the broader S&P500 index. There is more to the comparison, and in the sections below, we discuss why we believe EL stock will offer better returns than PG stock in the next three years. We compare a slew of factors, such as historical revenue growth, returns, and valuation, in an interactive dashboard analysis of Procter & Gamble vs. Estee Lauder: Which Stock Is A Better Bet? Parts of the analysis are summarized below.
1. Estee Lauder’s Revenue Growth Over Recent Years Is Better
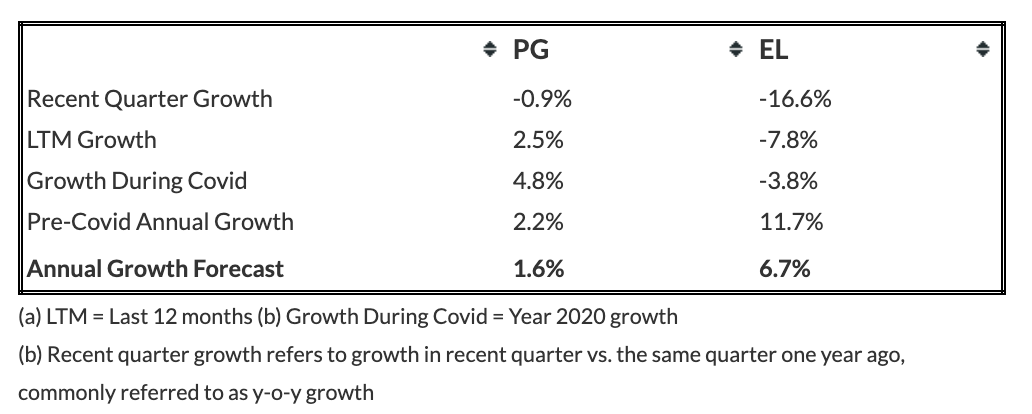
- P&G’s sales growth of 2.5% over the last twelve months has fared better than -7.8% for Estee Lauder.
- However, if we look at a slightly longer time frame, Estee Lauder fares better, with its sales rising at an average annual growth rate of 6.3% to $17.7 billion in fiscal 2022, compared to $14.9 billion in 2019, while P&G saw its sales rise at an average rate of 5.8% to $80.2 billion in 2022, compared to $67.7 billion in 2019.
- P&G’s largest segment is Fabric & Home Care, contributing around 35% of the company’s revenues. It has also seen a steady rise in sales over recent years. In 2022, the company reported a 5% rise in total sales, driven by a 2% growth in unit volume.
- However, in its latest quarter, P&G reported a 1% decline in reported sales, primarily due to forex headwinds. Organic sales grew 5%, driven by better price realization, but shipment volume declined.
- Estee Lauder is an American multinational manufacturer and marketer of skin care, makeup, fragrance, and hair care products, with a presence in global markets. Skin care sales are the largest contributor to the company’s net sales, bringing in 56% ($9.9 billion) of Estee Lauder’s revenues in fiscal 2022.
- The company benefited from a travel recovery and opening up of economies in fiscal 2022.
- However, this momentum has cooled off, and China’s recent lockdowns have weighed on its sales growth. Skin care revenues plunged 20% to $4.5 billion for the six months ending Dec 2022. Fragrance and makeup product sales also witnessed a decline over this period.
- Given the challenging environment of high inflation, rising interest rates, a strengthening U.S. dollar, and the economy feared to go into recession, P&G and Estee Lauder’s volume will likely be adversely impacted in the near term.
- Our Procter & Gamble Revenue Comparison and Estee Lauder Revenue Comparison dashboards provide more insight into the companies’ sales.
- Looking forward, Estee Lauder is expected to post better sales growth over the next three years. The table below summarizes our revenue expectations for the two companies over the next three years. It points to a CAGR of 2% for P&G and 7% for Estee Lauder, based on Trefis Machine Learning analysis.
- Note that we have different methodologies for companies that are negatively impacted by Covid and those that are not impacted or positively impacted by Covid while forecasting future revenues. For companies negatively affected by Covid, we consider the quarterly revenue recovery trajectory to forecast recovery to the pre-Covid revenue run rate. Beyond the recovery point, we apply the average annual growth observed three years before Covid to simulate a return to normal conditions. For companies registering positive revenue growth during Covid, we consider yearly average growth before Covid with a certain weight to growth during Covid and the last twelve months.
- Should You Pick Home Depot Stock Over Procter & Gamble?
- Is Procter & Gamble Stock Appropriately Priced At $160?
- Should You Pick Procter & Gamble Stock At $155 After A Mixed Q2?
- Is Procter & Gamble Stock Fully Valued At $150?
- Will Procter & Gamble Stock Continue To Rise After 27% Gains In The Ongoing Inflation Shock?
- Should You Buy TMUS Over Procter & Gamble Stock For Better Returns?
2. P&G Is More Profitable
- P&G’s operating margin of 22.2% over the last twelve months is better than 13.6% for Estee Lauder.
- This compares with 8.8% and 16.9% figures in 2019, before the pandemic, respectively.
- If we look at the recent margin decline, P&G has fared better, with the last twelve months vs. last three-year margin change at -1%, compared to a -3% change for Estee Lauder.
- P&G’s free cash flow margin of 18% is also higher than the 12% for Estee Lauder.
- Our Procter & Gamble Operating Income Comparison and Estee Lauder Operating Income Comparison dashboards have more details.
- Looking at financial risk, Estee Lauder fares better, with its 6% debt as a percentage of equity lower than 10% for P&G. Furthermore, its 18% cash as a percentage of assets is also higher than 6% for the latter, implying that Estee Lauder has a better debt position and has more cash cushion.
3. The Net of It All
- We see that P&G is more profitable and is trading at a comparatively lower valuation multiple. On the other hand, Estee Lauder has seen better revenue growth over recent years and offers lower financial risk.
- Now, looking at prospects, using P/S as a base, due to high fluctuations in P/E and P/EBIT, we believe Estee Lauder stock is the better pick among the two.
- The table below summarizes our revenue and return expectation for both companies over the next three years and points to an expected return of 0% for PG over this period vs. a 14% expected return for EL stock, based on Trefis Machine Learning analysis – Procter & Gamble vs. Estee Lauder – which also provides more details on how we arrive at these numbers.

While EL stock may outperform PG stock in the next three years, it is helpful to see how Procter & Gamble’s Peers fare on metrics that matter. You will find other valuable comparisons for companies across industries at Peer Comparisons.
Furthermore, the Covid-19 crisis has created many pricing discontinuities which can offer attractive trading opportunities. For example, you’ll be surprised at how counter-intuitive the stock valuation is for Citrix Systems vs. Procter & Gamble.
With higher inflation and the Fed raising interest rates, among other factors, PG stock has fallen 5% in the last twelve months. Can it drop more? See how low Procter & Gamble stock can go by comparing its decline in previous market crashes. Here is a performance summary of all stocks in previous market crashes.
What if you’re looking for a more balanced portfolio instead? Our high-quality portfolio and multi-strategy portfolio have beaten the market consistently since the end of 2016.
| Returns | Apr 2023 MTD [1] |
2023 YTD [1] |
2017-23 Total [2] |
| PG Return | 2% | 0% | 81% |
| EL Return | 2% | 1% | 229% |
| S&P 500 Return | 1% | 8% | 85% |
| Trefis Multi-Strategy Portfolio | 1% | 9% | 245% |
[1] Month-to-date and year-to-date as of 4/14/2023
[2] Cumulative total returns since the end of 2016
Invest with Trefis Market Beating Portfolios
See all Trefis Price Estimates