How Will PepsiCo Stock React To Its Upcoming Earnings?

PepsiCo (NASDAQ:PEP) is scheduled to announce its earnings on Thursday, July 17, 2025. For event-driven traders, understanding historical stock performance around earnings releases can offer a strategic advantage, although actual results against consensus estimates will be the primary driver.
Historically, PEP stock has shown a strong tendency for positive one-day returns following earnings reports. Over the past five years, the stock has risen on the day after earnings in 78% of instances, with a median positive return of 1.5% and a maximum one-day gain of 3.6%.
Traders can approach this event in two ways:
- Pre-earnings positioning: Based on historical odds, traders might consider taking a position before the earnings release.
- Post-earnings positioning: Analyze the correlation between immediate and medium-term returns after the earnings are released to inform trading decisions.
Current consensus estimates project PepsiCo to report earnings of $2.03 per share on sales of $22.3 billion. This is lower than the year-ago quarter’s earnings of $2.28 per share on sales of $22.5 billion.
- Own PepsiCo For Beverage Growth? Keurig Dr Pepper’s Case Is Stronger
- COKE Looks Smarter Buy Than PepsiCo Stock
- COKE Tops PepsiCo Stock on Price & Potential
- PepsiCo Stock Pays Out $38 Bil – Investors Take Note
- KDP Tops PepsiCo Stock on Price & Potential
- Stronger Bet Than PepsiCo Stock: KDP Delivers More
From a fundamental perspective, PepsiCo currently has a market capitalization of $186 billion. Over the last twelve months, the company generated $92 billion in revenue, with $13 billion in operating profits and a net income of $9.4 billion, indicating strong operational profitability.
That said, if you seek upside with lower volatility than individual stocks, the Trefis High Quality portfolio presents an alternative — having outperformed the S&P 500 and generated returns exceeding 91% since its inception. Also, see – Trump’s Russia Math, Simplified
See earnings reaction history of all stocks
Image by Shaarc from Pixabay
PepsiCo’s Historical Odds Of Positive Post-Earnings Return
Some observations on one-day (1D) post-earnings returns:
- There are 18 earnings data points recorded over the last five years, with 14 positive and 4 negative one-day (1D) returns observed. In summary, positive 1D returns were seen about 78% of the time.
- Notably, this percentage increases to 82% if we consider data for the last 3 years instead of 5.
- Median of the 14 positive returns = 1.5%, and median of the 4 negative returns = -1.1%
Additional data for observed 5-Day (5D), and 21-Day (21D) returns post earnings are summarized along with the statistics in the table below.
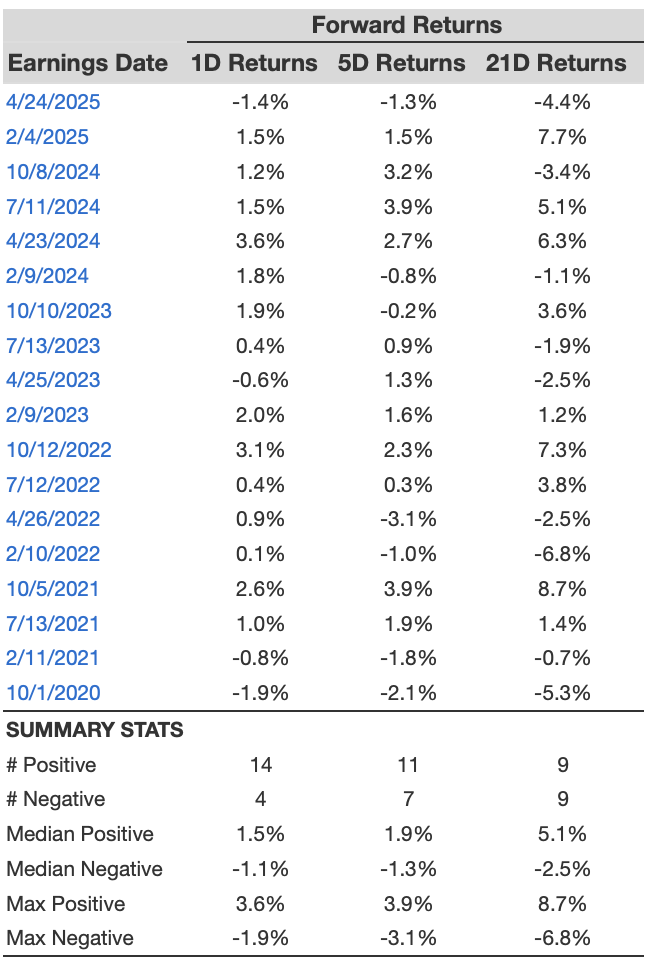
PEP 1D, 5D, and 21D Post Earnings Return
Correlation Between 1D, 5D, and 21D Historical Returns
A relatively less risky strategy (though not useful if the correlation is low) is to understand the correlation between short-term and medium-term returns post earnings, find a pair that has the highest correlation, and execute the appropriate trade. For example, if 1D and 5D show the highest correlation, a trader can position themselves “long” for the next 5 days if 1D post-earnings return is positive. Here is some correlation data based on 5-year and 3-year (more recent) history. Note that the correlation 1D_5D refers to the correlation between 1D post-earnings returns and subsequent 5D returns.
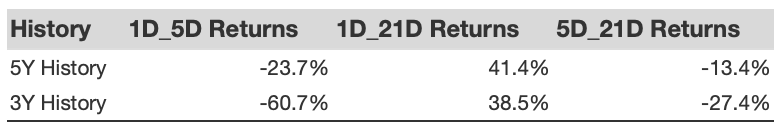
Correlation Between 1D, 5D and 21D Historical Returns
Is There Any Correlation With Peer Earnings?
Sometimes, peer performance can have influence on post-earnings stock reaction. In fact, the pricing-in might begin before the earnings are announced. Here is some historical data on the past post-earnings performance of PepsiCo stock compared with the stock performance of peers that reported earnings just before PepsiCo. For fair comparison, peer stock returns also represent post-earnings one-day (1D) returns.
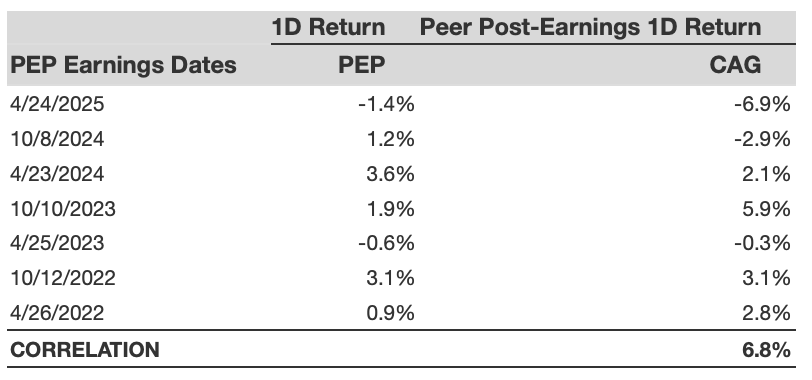
PEP Correlation With Peer Earnings
Learn more about Trefis RV strategy that has outperformed its all-cap stocks benchmark (combination of all 3, the S&P 500, S&P mid-cap, and Russell 2000), to produce strong returns for investors. Separately, if you want upside with a smoother ride than an individual stock like PepsiCo, consider the High Quality portfolio, which has outperformed the S&P, and clocked >91% returns since inception.
Invest with Trefis Market-Beating Portfolios
See all Trefis Price Estimates