How Will NetApp’s Stock React To Its Upcoming Earnings?

Note: NTAP FY’2025 ended in April
NetApp (NASDAQ: NTAP) is scheduled to report its fiscal first-quarter 2026 earnings on Wednesday, August 27, 2025. Analysts expect earnings of $1.54 per share on revenue of $1.54 billion, implying a slight year-over-year decline in earnings and flat sales compared to the prior year’s figures of $1.56 per share and $1.54 billion in revenue. Historically, NTAP shares have risen following earnings 60% of the time, with a median one-day gain of 4.4% and a maximum observed increase of 18%.
For fiscal 2026, NetApp has guided revenue of $6.63–$6.88 billion (3–4% growth), gross margins of 71–72%, and non-GAAP EPS of $7.60–$7.90. First-quarter guidance calls for $1.46–$1.61 billion in revenue and EPS of $1.48–$1.58. Management has emphasized profitability and shareholder returns, targeting the return of up to 100% of free cash flow through dividends and buybacks. NetApp currently carries a market capitalization of about $22 billion. Over the last twelve months, it generated $6.6 billion in revenue, with $1.4 billion in operating profit and $1.2 billion in net income, underscoring its operational strength despite muted top-line growth. Separately, check: Is Booking Holdings Stock Staring At a 40% Downside?
For event-driven traders, historical earnings reaction patterns may provide useful context when positioning ahead of results or responding to post-release moves. That said, for investors seeking more stable upside than individual stock events typically offer, the Trefis High Quality portfolio provides an alternative, having outperformed the S&P 500 with cumulative returns of over 91% since inception. See earnings reaction history of all stocks

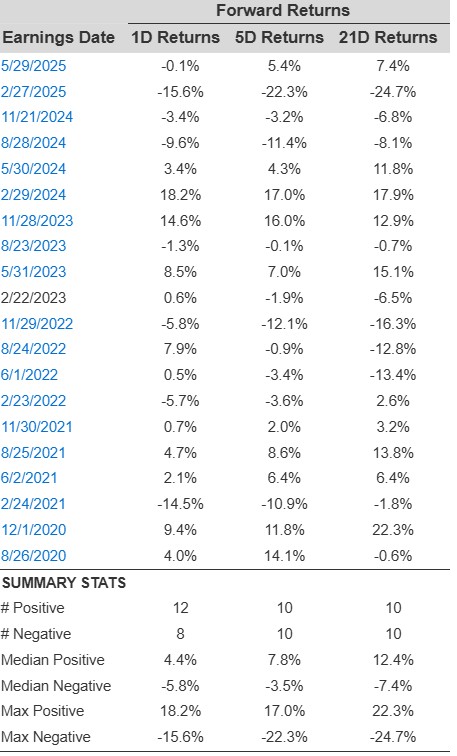
NetApp’s Historical Odds Of Positive Post-Earnings Return
Some observations on one-day (1D) post-earnings returns:
- There are 20 earnings data points recorded over the last five years, with 12 positive and 8 negative one-day (1D) returns observed. In summary, positive 1D returns were seen about 60% of the time.
- However, this percentage decreases to 45% if we consider data for the last 3 years instead of 5.
- Median of the 12 positive returns = 4.4%, and median of the 8 negative returns = -5.8%
Additional data for observed 5-Day (5D) and 21-Day (21D) returns post earnings are summarized along with the statistics in the table below.
NTAP Correlation Between 1D, 5D, and 21D Forward Returns
Correlation Between 1D, 5D, and 21D Historical Returns
A relatively less risky strategy (though not useful if the correlation is low) is to understand the correlation between short-term and medium-term returns post earnings, find a pair that has the highest correlation, and execute the appropriate trade. For example, if 1D and 5D show the highest correlation, a trader can position themselves “long” for the next 5 days if 1D post-earnings return is positive. Here is some correlation data based on 5-year and 3-year (more recent) history. Note that the correlation 1D_5D refers to the correlation between 1D post-earnings returns and subsequent 5D returns.
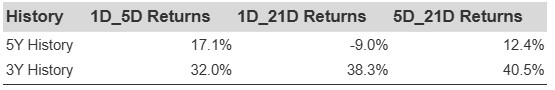
NTAP Correlation Between 1D, 5D and 21D Historical Returns
Is There Any Correlation With Peer Earnings?
Sometimes, peer performance can have influence on post-earnings stock reaction. In fact, the pricing-in might begin before the earnings are announced. Here is some historical data on the past post-earnings performance of NetApp stock compared with the stock performance of peers that reported earnings just before NetApp. For fair comparison, peer stock returns also represent post-earnings one-day (1D) returns.
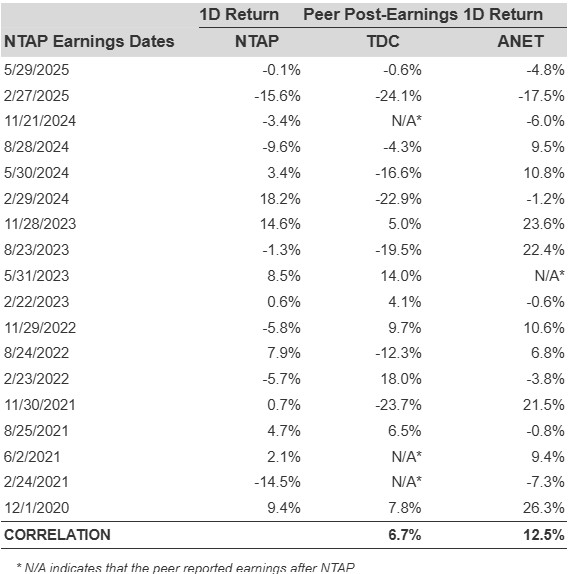
NTAP Correlation Between Peers
Learn more about Trefis RV strategy that has outperformed its all-cap stocks benchmark (a combination of all 3, the S&P 500, S&P mid-cap, and Russell 2000), to produce strong returns for investors.
Invest with Trefis Market-Beating Portfolios