Can Nike Break Its Post-Earnings Losing Streak?

Nike (NYSE: NKE) is scheduled to release its fiscal first-quarter earnings (May fiscal year) on Tuesday, September 30, 2025, with analysts projecting earnings of 26 cents per share on $10.99 billion in revenue. This would represent a 63% year-over-year decline in earnings and a 5% fall in sales compared to the prior year’s figures of $0.70 per share and $11.61 billion in revenue. Historically, NKE stock has declined 63% of the time following earnings announcements, with a median one-day drop of 6.5% and a maximum observed decline of 20%. Also, see Buy or Sell Nike Stock?
Nike entered Q1 FY2026 with guidance pointing to a mid-single digit revenue decline and a 350–425 bps hit to gross margin, including about 100 bps from new U.S. tariffs. Expenses are set to rise modestly in the low single-digits as the company leans into brand and wholesale investments. Tariffs, aging inventory, and weak China demand remain key drags, while execution on the “Win Now” turnaround will determine whether Nike can stabilize the slide. Separately check, NuScale Stock: Big Gains, Bigger Risk
The company has $102 Bil in current market capitalization. Revenue over the last twelve months was $46 Bil, and it was operationally profitable with $3.7 Bil in operating profits and net income of $3.2 Bil. While a lot will depend on how results stack up against consensus and expectations, understanding historical patterns might just turn the odds in your favor if you are an event-driven trader.
For event-driven traders, historical patterns may offer an edge, whether by positioning ahead of earnings or reacting to post-release moves. That said, if you seek upside with lower volatility than from individual stocks, the Trefis High Quality portfolio presents an alternative, having outperformed the S&P 500 and generated returns exceeding 91% since its inception. See earnings reaction history of all stocks.
- Nike Stock Hands $28 Bil Back – Worth a Look?
- The Bear Case: How NKE Behaves During Market Shocks
- The Bear Case: How NKE Behaves During Market Shocks
- The Bear Case: How NKE Behaves During Market Shocks
- Stress Testing NKE: Historical Drawdowns and Macro Risks
- Stronger Bet Than Nike Stock: TPR, RL Deliver More

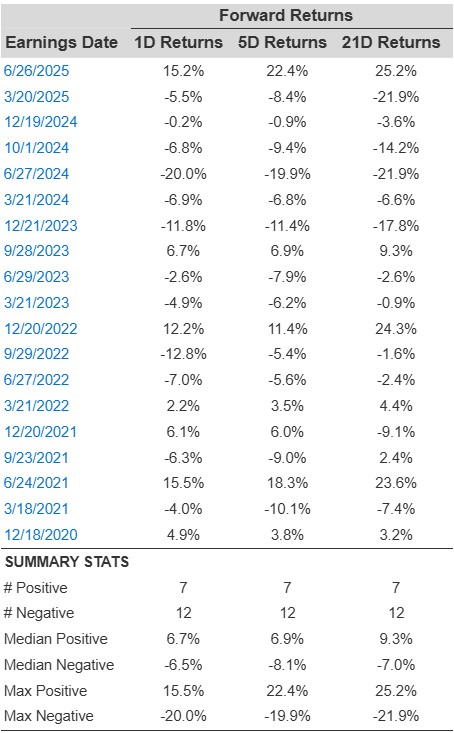
Historical Odds Of Positive Post-Earnings Return
Some observations on one-day (1D) post-earnings returns:
- There are 19 earnings data points recorded over the last five years, with 7 positive and 12 negative one-day (1D) returns observed. In summary, positive 1D returns were seen about 37% of the time.
- However, this percentage decreases to 25% if we consider data for the last 3 years instead of 5.
- Median of the 7 positive returns = 6.7%, and median of the 12 negative returns = -6.5%
Additional data for observed 5-Day (5D) and 21-Day (21D) returns post earnings are summarized along with the statistics in the table below.
NKE Correlation Between 1D, 5D, and 21D Forward Returns
Correlation Between 1D, 5D, and 21D Historical Returns
A relatively less risky strategy (though not useful if the correlation is low) is to understand the correlation between short-term and medium-term returns post earnings, find a pair that has the highest correlation, and execute the appropriate trade. For example, if 1D and 5D show the highest correlation, a trader can position themselves “long” for the next 5 days if 1D post-earnings return is positive. Here is some correlation data based on 5-year and 3-year (more recent) history. Note that the correlation 1D_5D refers to the correlation between 1D post-earnings returns and subsequent 5D returns.
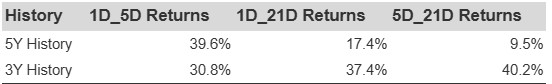
NKE Correlation Between 1D, 5D, and 21D Historical Returns
Learn more about Trefis RV strategy that has outperformed its all-cap stocks benchmark (combination of all 3, the S&P 500, S&P mid-cap, and Russell 2000), to produce strong returns for investors.
Invest with Trefis Market-Beating Portfolios