How Will Mastercard Stock React To Its Upcoming Earnings?

Mastercard (NYSE:MA) is set to report its earnings on Thursday, October 30, 2025. Revenues are likely to grow by about 16% year-over-year to $8.54 billion, per consensus estimates, while earnings are likely to rise 11% to $4.32 per share. Revenues will likely be supported by continued growth in gross dollar volume (GDV) – a key measure of total spending across the Mastercard network — as global consumer spending remains resilient. Cross-border volumes are also expected to stay strong, fueled by the sustained recovery in international travel and tourism, particularly across Europe and Asia. Additionally, Mastercard’s expanding portfolio of value-added services, including data analytics, cybersecurity, and fraud prevention, should continue to provide a some revenue upside beyond core transaction fees.

The company has $500 Bil in current market capitalization. Revenue over the last twelve months was $30 billion, and it was operationally profitable, with $18 billion in operating profits and net income of $14 billion. While a lot will depend on how results stack up against consensus and expectations, understanding historical patterns might just turn the odds in your favor if you are an event-driven trader.
There are two ways to do that: understand the historical odds and position yourself prior to the earnings release, or look at the correlation between immediate and medium-term returns post earnings and position yourself accordingly after the earnings are released. That said, if you seek upside with lower volatility than individual stocks, the Trefis High Quality portfolio presents an alternative – having outperformed the S&P 500 and generated returns exceeding 105% since its inception.
- Mastercard Stock Capital Return Hits $63 Bil
- Mastercard Stock Testing Price Floor – Buy Now?
- Mastercard Stock Pays Out $64 Bil – Investors Take Note
- Mastercard Stock Pays Out $64 Bil – Investors Take Note
- Why Does Mastercard Want To Buy ZeroHash?
- Mastercard Stock Delivers $63 Bil to Shareholders Over the Last 10 Years
See earnings reaction history of all stocks
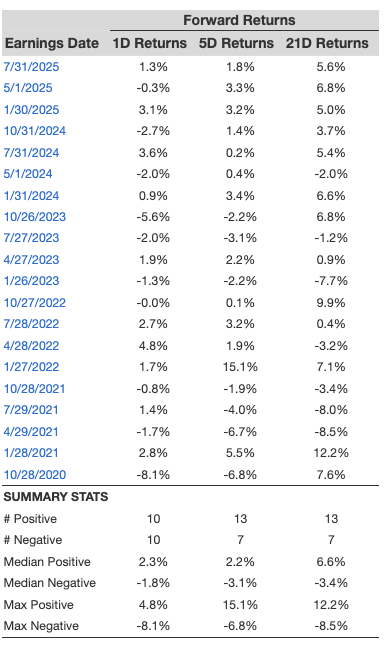
Mastercard’s Historical Odds Of Positive Post-Earnings Return
Some observations on one-day (1D) post-earnings returns:
- There are 20 earnings data points recorded over the last five years, with 10 positive and 10 negative one-day (1D) returns observed. In summary, positive 1D returns were seen about 50% of the time.
- However, this percentage decreases to 42% if we consider data for the last 3 years instead of 5.
- Median of the 10 positive returns = 2.3%, and median of the 10 negative returns = -1.8%
Additional data for observed 5-Day (5D) and 21-Day (21D) returns post earnings are summarized along with the statistics in the table below.
1D, 5D, and 21D Post Earnings Return
Correlation Between 1D, 5D, and 21D Historical Returns
A relatively less risky strategy (though not useful if the correlation is low) is to understand the correlation between short-term and medium-term returns post earnings, find a pair that has the highest correlation, and execute the appropriate trade. For example, if 1D and 5D show the highest correlation, a trader can position themselves “long” for the next 5 days if the 1D post-earnings return is positive. Here is some correlation data based on a 5-year and a 3-year (more recent) history. Note that the correlation 1D_5D refers to the correlation between 1D post-earnings returns and subsequent 5D returns.
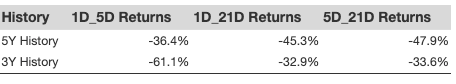
Correlation Between 1D, 5D and 21D Historical Returns
Learn more about Trefis RV strategy that has outperformed its all-cap stocks benchmark (combination of all 3, the S&P 500, S&P mid-cap, and Russell 2000), to produce strong returns for investors. Separately, if you want upside with a smoother ride than an individual stock like Mastercard, consider the High Quality portfolio, which has outperformed the S&P and clocked >105% returns since inception.