How Will LVS Stock React To Its Upcoming Earnings?

Las Vegas Sands stock (NYSE: LVS), a casino and resort company operating in Macau and Singapore, is set to report its fiscal third-quarter earnings on Wednesday, October 22, 2025. Analysts predict the company will report adjusted earnings of $0.62 per share on $3.05 billion in sales. This would represent a 41% increase in earnings and a 14% growth in sales compared to the previous year’s figures of $0.44 per share and $2.68 billion, respectively. Investors will closely watch the company’s performance amid ongoing challenges, including macro pressures and tariff concerns. Historical data show that the stock has increased 65% of the time in the one day following earnings announcements, with a median rise of 4.3% and maximum one-day positive returns reaching 11%. Separately, see GE Aerospace Stock Surged 65%: Here’s Why
LVS delivered a strong Q2 2025, posting $3.18 billion in revenue and $0.79 in adjusted EPS. EBITDA rose to $1.33 billion, driven by record Marina Bay Sands results and a Macau rebound. The company also bought back $800 million in stock and increased its Sands China stake to 73.4%. The company has $34 Bil in current market capitalization. Revenue over the last twelve months was $12 Bil, and it was operationally profitable with $2.5 Bil in operating profits and net income of $1.4 Bil. While a lot will depend on how results stack up against consensus and expectations, understanding historical patterns might just turn the odds in your favor if you are an event-driven trader.
There are two ways to do that: understand the historical odds and position yourself before the earnings release, or look at the correlation between immediate and medium-term returns post-earnings and position yourself accordingly after the earnings are released. That said, if you seek upside with lower volatility than individual stocks, the Trefis High Quality portfolio presents an alternative, having outperformed the S&P 500 and generated returns exceeding 105% since its inception. See earnings reaction history of all stocks.

- With Las Vegas Sands Stock Climbed 45% In A Month, How Confident Are You?
- Las Vegas Sands Stock Near Crucial Support – Buy Signal?
- Las Vegas Sands Is Booming Again, But Watch The Price Tag
- LVS Testing Price Floor: Time to Load Up?
- S&P 500 Movers | Winners: HUM, CNC, CI | Losers: PLTR, LVS, WYNN
- LVS Stock Down -6.8% after 5-Day Loss Streak
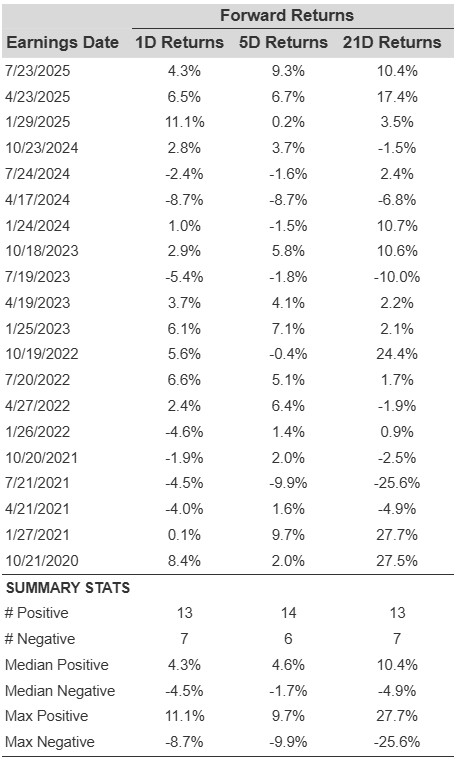
LVS’ Historical Odds Of Positive Post-Earnings Return
Some observations on one-day (1D) post-earnings returns:
- There are 20 earnings data points recorded over the last five years, with 13 positive and 7 negative one-day (1D) returns observed. In summary, positive 1D returns were seen about 65% of the time.
- Notably, this percentage increases to 75% if we consider data for the last 3 years instead of 5.
- Median of the 13 positive returns = 4.3%, and median of the 7 negative returns = -4.5%
Additional data for observed 5-Day (5D) and 21-Day (21D) returns post earnings are summarized along with the statistics in the table below.
LVS Correlation Between 1D, 5D , and 21D Forward Returns
Correlation Between 1D, 5D, and 21D Historical Returns
A relatively less risky strategy (though not useful if the correlation is low) is to understand the correlation between short-term and medium-term returns post earnings, find a pair that has the highest correlation, and execute the appropriate trade. For example, if 1D and 5D show the highest correlation, a trader can position themselves “long” for the next 5 days if 1D post-earnings return is positive. Here is some correlation data based on 5-year and 3-year (more recent) history. Note that the correlation 1D_5D refers to the correlation between 1D post-earnings returns and subsequent 5D returns.
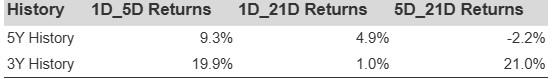
LVS Correlation Between 1D, 5D , and 21D Historical Returns
Learn more about Trefis RV strategy that has outperformed its all-cap stocks benchmark (combination of all 3, the S&P 500, S&P mid-cap, and Russell 2000), to produce strong returns for investors.
Invest with Trefis Market-Beating Portfolios