How To Trade Coca-Cola Stock Ahead of Its Upcoming Earnings?

Coca-Cola (NYSE: KO) is scheduled to announce its earnings on Tuesday, October 21, 2025. Based on the last five years of data, Coca-Cola stock has demonstrated a tendency for positive one-day returns following earnings announcements, occurring in 67% of instances. The median positive return observed was 1.3%, with a maximum one-day positive return of 4.7%.
For event-driven traders, while actual results relative to consensus and expectations are crucial, understanding these historical patterns can offer a strategic advantage. There are two primary strategies to consider:
- Pre-earnings positioning: Analyze the historical probabilities and establish a position before the earnings release.
- Post-earnings positioning: Evaluate the correlation between immediate and medium-term returns after the earnings release to guide your trading decisions.
Analysts expect Coca-Cola to report earnings of $0.78 per share on sales of $12.41 billion. This compares to the year-ago quarter’s earnings of $0.77 per share on sales of $11.95 billion.
From a fundamental perspective, the company currently holds a market capitalization of $291 billion. Over the last twelve months, Coca-Cola generated $47 billion in revenue, achieving $14 billion in operating profits and a net income of $12 billion.
That being said, if you seek an upside with less volatility than holding an individual stock, consider the High Quality Portfolio. It has comfortably outperformed its benchmark—a combination of the S&P 500, Russell, and S&P MidCap indexes—and has achieved returns exceeding 105% since its inception. Why is that? As a group, HQ Portfolio stocks provided better returns with less risk versus the benchmark index; less of a roller-coaster ride, as evident in HQ Portfolio performance metrics.
See earnings reaction history of all stocks

Image by Elaine Gonzaga from Pixabay
Coca-Cola’s Historical Odds Of Positive Post-Earnings Return
Some observations on one-day (1D) post-earnings returns:
- There are 18 earnings data points recorded over the last five years, with 12 positive and 6 negative one-day (1D) returns observed. In summary, positive 1D returns were seen about 67% of the time.
- However, this percentage decreases to 55% if we consider data for the last 3 years instead of 5.
- Median of the 12 positive returns = 1.3%, and median of the 6 negative returns = -0.6%
Additional data for observed 5-Day (5D), and 21-Day (21D) returns post earnings are summarized along with the statistics in the table below.
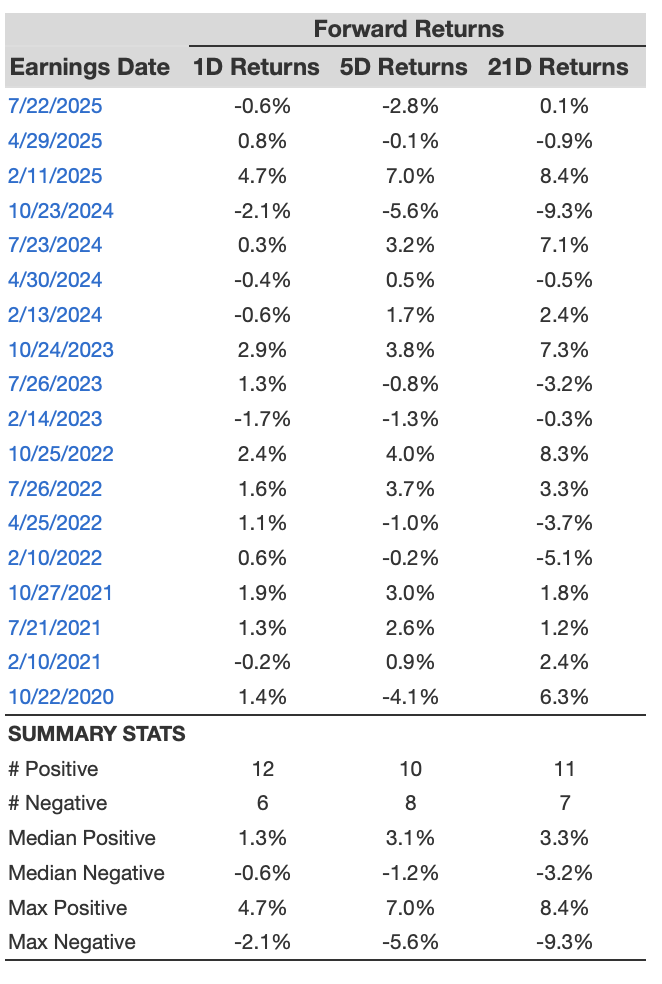
KO 1D, 5D, and 21D Post Earnings Return
Correlation Between 1D, 5D, and 21D Historical Returns
A relatively less risky strategy (though not useful if the correlation is low) is to understand the correlation between short-term and medium-term returns post earnings, find a pair that has the highest correlation, and execute the appropriate trade. For example, if 1D and 5D show the highest correlation, a trader can position themselves “long” for the next 5 days if the 1D post-earnings return is positive. Here is some correlation data based on a 5-year and a 3-year (more recent) history. Note that the correlation 1D_5D refers to the correlation between 1D post-earnings returns and subsequent 5D returns.
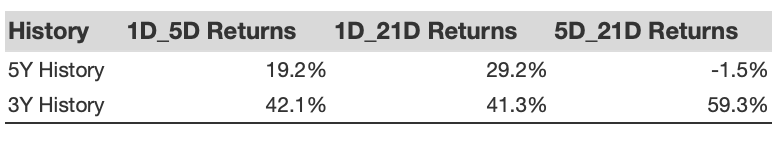
Correlation Between 1D, 5D, and 21D Historical Returns
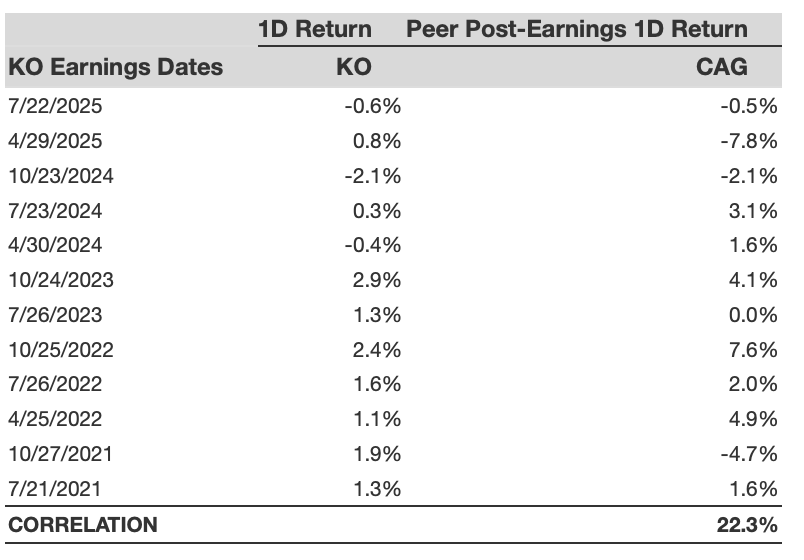
Is There Any Correlation With Peer Earnings?
Sometimes, peer performance can have an influence on post-earnings stock reaction. In fact, the pricing-in might begin before the earnings are announced. Here is some historical data on the past post-earnings performance of Coca-Cola stock compared with the stock performance of peers that reported earnings just before Coca-Cola. For fair comparison, peer stock returns also represent post-earnings one-day (1D) returns.
Investing in a single stock without comprehensive analysis can be risky. Consider the Trefis Reinforced Value (RV) Portfolio, which has outperformed its all-cap stocks benchmark (combination of the S&P 500, S&P mid-cap, and Russell 2000 benchmark indices) to produce strong returns for investors. Why is that? The quarterly rebalanced mix of large-, mid-, and small-cap RV Portfolio stocks provided a responsive way to make the most of upbeat market conditions while limiting losses when markets head south, as detailed in RV Portfolio performance metrics.
Invest with Trefis Market-Beating Portfolios
See all Trefis Price Estimates