How Will Johnson & Johnson Stock React To Its Upcoming Earnings?

Johnson & Johnson (NYSE:JNJ) is scheduled to announce its earnings on Wednesday, July 16, 2025. For event-driven traders, understanding historical stock performance around earnings reports can be a valuable tool, potentially tilting the odds in your favor. Historically, JNJ has shown positive one-day returns in 55% of instances following earnings releases over the past five years. The median positive return on these days has been 2.3%, with a maximum one-day positive return of 6.1%. Also, see Will The Rally In XRP Price Continue?
There are two primary approaches to consider:
- Pre-Earnings Positioning: Based on historical odds, you could consider taking a position before the earnings release.
- Post-Earnings Positioning: Alternatively, you might wait for the earnings to be released and then analyze the correlation between immediate and medium-term returns to inform your trading decisions.
Analysts are forecasting JNJ to report earnings of $2.68 per share on sales of $22.86 billion. This compares to the same quarter last year, when the company reported earnings of $2.82 per share on sales of $22.45 billion.
From a fundamental perspective, JNJ currently boasts a market capitalization of $378 billion. Over the last twelve months, the company generated $89 billion in revenue, with strong operational profitability, reporting $22 billion in operating profits and $22 billion in net income. If you seek upside with lower volatility than individual stocks, the Trefis High Quality portfolio presents an alternative — having outperformed the S&P 500 and generated returns exceeding 91% since its inception.
- JNJ Stock’s 60% Breakout: Why Wall Street is Torn
- Should You Pay Attention To Johnson & Johnson Stock’s Momentum?
- Johnson & Johnson Stock Surged 60%, Here’s Why
- Does Johnson & Johnson Stock Have More Upside?
- Johnson & Johnson Stock Hands $160 Bil Back – Worth a Look?
- What’s Driving Johnson & Johnson Stock?
See earnings reaction history of all stocks

Image by günter from Pixabay
Johnson & Johnson’s Historical Odds Of Positive Post-Earnings Return
Some observations on one-day (1D) post-earnings returns:
- There are 20 earnings data points recorded over the last five years, with 11 positive and 9 negative one-day (1D) returns observed. In summary, positive 1D returns were seen about 55% of the time.
- However, this percentage decreases to 33% if we consider data for the last 3 years instead of 5.
- Median of the 11 positive returns = 2.3%, and median of the 9 negative returns = -1.6%
Additional data for observed 5-Day (5D), and 21-Day (21D) returns post earnings are summarized along with the statistics in the table below.
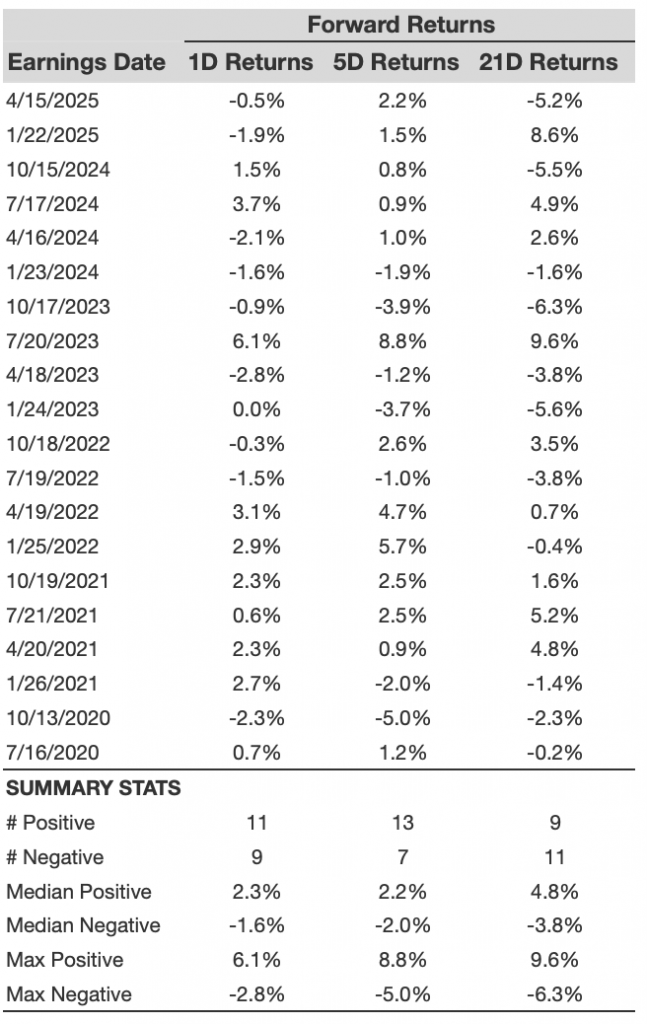
JNJ 1D, 5D, and 21D Post Earnings Return
Correlation Between 1D, 5D, and 21D Historical Returns
A relatively less risky strategy (though not useful if the correlation is low) is to understand the correlation between short-term and medium-term returns post earnings, find a pair that has the highest correlation, and execute the appropriate trade. For example, if 1D and 5D show the highest correlation, a trader can position themselves “long” for the next 5 days if 1D post-earnings return is positive. Here is some correlation data based on 5-year and 3-year (more recent) history. Note that the correlation 1D_5D refers to the correlation between 1D post-earnings returns and subsequent 5D returns.
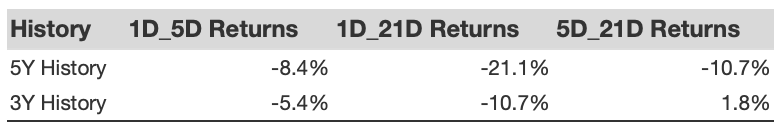
Correlation Between 1D, 5D and 21D Historical Returns
Is There Any Correlation With Peer Earnings?
Sometimes, peer performance can have influence on post-earnings stock reaction. In fact, the pricing-in might begin before the earnings are announced. Here is some historical data on the past post-earnings performance of Johnson & Johnson stock compared with the stock performance of peers that reported earnings just before Johnson & Johnson. For fair comparison, peer stock returns also represent post-earnings one-day (1D) returns.
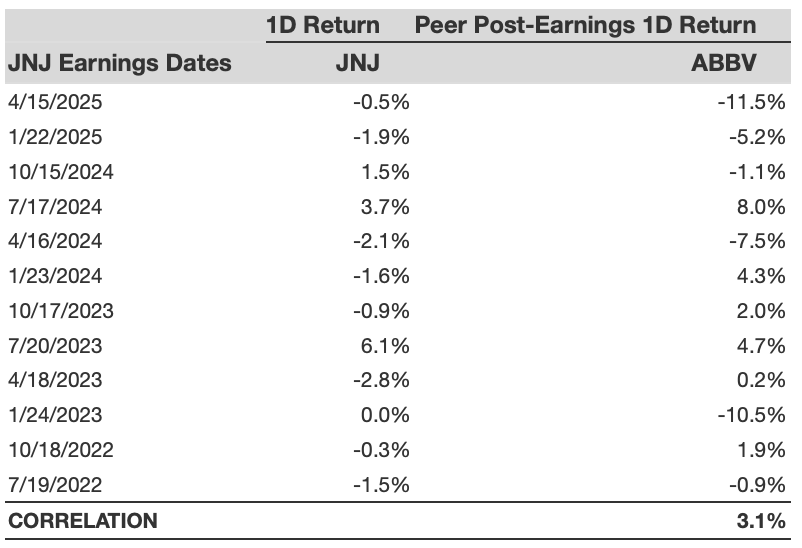
JNJ Correlation With Peer Earnings
Learn more about Trefis RV strategy that has outperformed its all-cap stocks benchmark (combination of all 3, the S&P 500, S&P mid-cap, and Russell 2000), to produce strong returns for investors. Separately, if you want upside with a smoother ride than an individual stock like Johnson & Johnson, consider the High Quality portfolio, which has outperformed the S&P, and clocked >91% returns since inception.
Invest with Trefis Market-Beating Portfolios
See all Trefis Price Estimates