How To Trade Gitlab Stock Ahead Of Earnings?

GitLab (NASDAQ:GTLB) a company that provides tools to help teams manage their software development lifecycle, is expected to publish its Q1 results on June 10. Consensus estimates point to revenues of about $213 million for the quarter, an increase of 26% year-over-year, while earnings are projected at about $0.15 per share, up almost 5x compared to last year. Historical trends suggest the stock has a good chance of moving higher post earnings, with GitLab posting a positive one-day return following earnings about 75% of the time over the last three years. The company has $7.4 billion in current market capitalization. Revenue over the last twelve months was $759 Mil, and it was operationally loss-making with $-143 million in operating losses and net income of $-6.3 million. That said, if you seek upside with lower volatility than individual stocks, the Trefis High Quality portfolio presents an alternative, having outperformed the S&P 500 and generated returns exceeding 91% since its inception.
See earnings reaction history of all stocks
GitLab’s Historical Odds Of Positive Post-Earnings Return
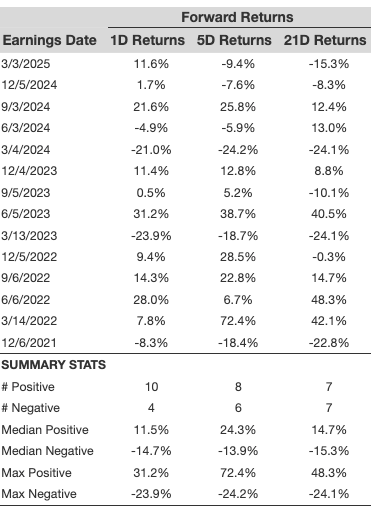
Some observations on one-day (1D) post-earnings returns:
- There are 14 earnings data points recorded over the last five years, with 10 positive and 4 negative one-day (1D) returns observed. In summary, positive 1D returns were seen about 71% of the time.
- Notably, this percentage increases to 75% if we consider data for the last 3 years instead of 5.
- Median of the 10 positive returns = 12%, and median of the 4 negative returns = -15%
Additional data for observed 5-Day (5D), and 21-Day (21D) returns post earnings are summarized along with the statistics in the table below.
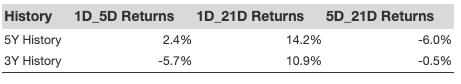
Correlation Between 1D, 5D, and 21D Historical Returns
A relatively less risky strategy (though not useful if the correlation is low) is to understand the correlation between short-term and medium-term returns post earnings, find a pair that has the highest correlation, and execute the appropriate trade. For example, if 1D and 5D show the highest correlation, a trader can position themselves “long” for the next 5 days if the 1D post-earnings return is positive. Here is some correlation data based on a 5-year and a 3-year (more recent) history. Note that the correlation 1D_5D refers to the correlation between 1D post-earnings returns and subsequent 5D returns.
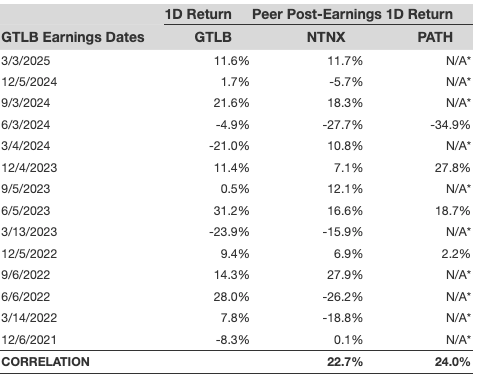
Is There Any Correlation With Peer Earnings?
Sometimes, peer performance can have an influence on post-earnings stock reaction. In fact, the pricing-in might begin before the earnings are announced. Here is some historical data on the past post-earnings performance of GitLab stock compared with the stock performance of peers that reported earnings just before GitLab. For fair comparison, peer stock returns also represent post-earnings one-day (1D) returns.
Learn more about Trefis RV strategy that has outperformed its all-cap stocks benchmark (combination of all 3, the S&P 500, S&P mid-cap, and Russell 2000), to produce strong returns for investors. Separately, if you want upside with a smoother ride than an individual stock like GitLab, consider the High Quality portfolio, which has outperformed the S&P, and clocked >91% returns since inception.