How To Trade GameStop Stock Ahead of Its Upcoming Earnings?
Meme stock – GameStop (NYSE:GME) – is scheduled to announce its earnings on Tuesday, June 10, 2025. Historically, GameStop’s stock has shown a positive one-day return in 55% of instances following earnings announcements over the past five years. The median positive return has been 10.2%, with a maximum one-day gain of 35.2%.
For event-driven traders, understanding these historical patterns can be beneficial, though actual results compared to consensus estimates will heavily influence the stock’s movement. Here are two ways to approach trading GameStop’s earnings:
- Pre-Earnings Positioning: Analyze the historical odds of a positive post-earnings return and take a position before the announcement.
- Post-Earnings Positioning: Examine the correlation between immediate and medium-term returns after the earnings release to inform your trading decisions.
GameStop has significantly diversified its business beyond traditional brick-and-mortar video game sales. The company now offers a blend of physical and digital products, including consoles, collectibles, and digital games, and has even ventured into cryptocurrency investments, notably acquiring 4,710 bitcoins recently, valued at over $500 million.
For the upcoming earnings report, analysts project earnings of $0.08 per share on sales of $754 million. This contrasts with a loss of $0.12 per share on sales of $882 million in the same quarter last year. From a fundamental perspective, GameStop currently has a market capitalization of $13 billion. Over the last twelve months, the company reported revenue of $3.8 billion, an operating loss of $16 million, and a net income of $131 million.
That said, if you seek upside with lower volatility than individual stocks, the Trefis High Quality portfolio presents an alternative — having outperformed the S&P 500 and generated returns exceeding 91% since its inception. Separately, see – Is CRWD Stock Overvalued At $460?
See earnings reaction history of all stocks

Image by Sergei Tokmakov, Esq. https://Terms.Law from Pixabay
GameStop’s Historical Odds Of Positive Post-Earnings Return
Some observations on one-day (1D) post-earnings returns:
- There are 20 earnings data points recorded over the last five years, with 11 positive and 9 negative one-day (1D) returns observed. In summary, positive 1D returns were seen about 55% of the time.
- Notably, this percentage increases to 64% if we consider data for the last 3 years instead of 5.
- Median of the 11 positive returns = 10%, and median of the 9 negative returns = -18%
Additional data for observed 5-Day (5D), and 21-Day (21D) returns post earnings are summarized along with the statistics in the table below.
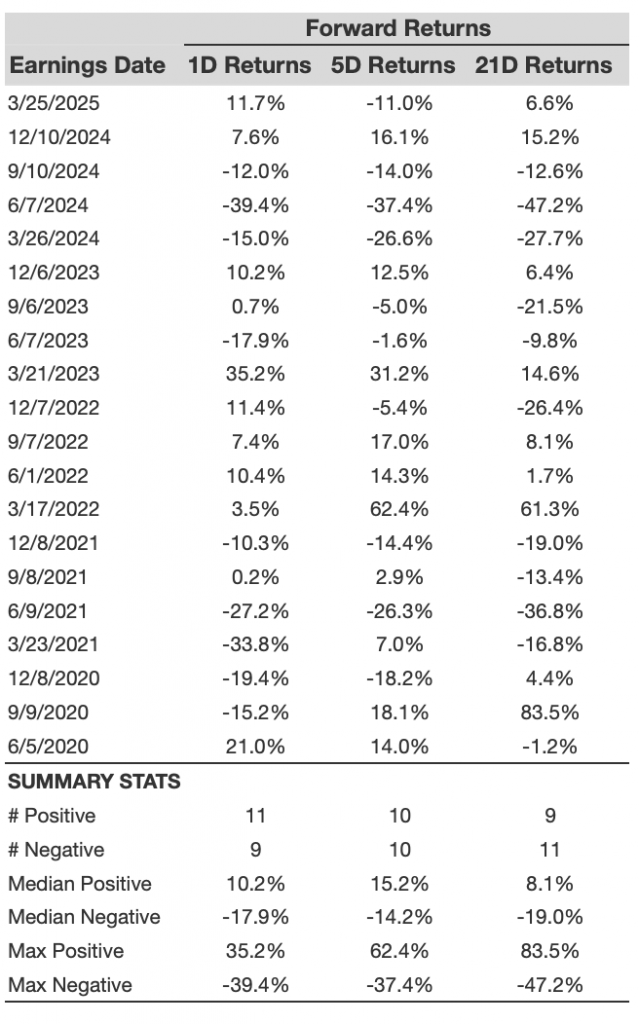
GME 1D, 5D, and 21D Post-Earnings Return
Correlation Between 1D, 5D, and 21D Historical Returns
A relatively less risky strategy (though not useful if the correlation is low) is to understand the correlation between short-term and medium-term returns post earnings, find a pair that has the highest correlation, and execute the appropriate trade. For example, if 1D and 5D show the highest correlation, a trader can position themselves “long” for the next 5 days if 1D post-earnings return is positive. Here is some correlation data based on 5-year and 3-year (more recent) history. Note that the correlation 1D_5D refers to the correlation between 1D post-earnings returns and subsequent 5D returns.
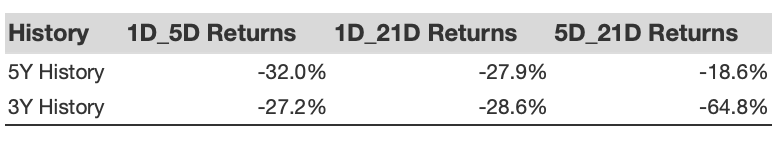
GME Correlation Between 1D, 5D and 21D Historical Returns
Is There Any Correlation With Peer Earnings?
Sometimes, peer performance can have influence on post-earnings stock reaction. In fact, the pricing-in might begin before the earnings are announced. Here is some historical data on the past post-earnings performance of GameStop stock compared with the stock performance of peers that reported earnings just before GameStop. For fair comparison, peer stock returns also represent post-earnings one-day (1D) returns.

GME Correlation With Peer Earnings
Learn more about Trefis RV strategy that has outperformed its all-cap stocks benchmark (combination of all 3, the S&P 500, S&P mid-cap, and Russell 2000), to produce strong returns for investors. Separately, if you want upside with a smoother ride than an individual stock like GameStop, consider the High Quality portfolio, which has outperformed the S&P, and clocked >91% returns since inception.
Invest with Trefis Market-Beating Portfolios
See all Trefis Price Estimates