How Will Gap’s Stock React To Its Upcoming Earnings?

Gap Inc. stock (NYSE: GAP) is set to report fiscal second-quarter earnings on Thursday, August 28, 2025. Consensus expectations call for earnings of $0.54 per share on revenue of $3.73 billion, both roughly flat compared to the prior year. In the first quarter, the company posted 2% sales growth, with comparable sales also up 2%, while EPS of $0.51 exceeded estimates. Margin expansion was supported by continued strength at Old Navy and the Gap brand. However, management cautioned that tariffs could reduce FY2025 operating income by $100–150 million, tempering its modest growth outlook. The retailer currently carries a market capitalization of $7.9 billion, supported by $15 billion in trailing twelve-month revenue, $1.2 billion in operating profit, and $879 million in net income. Notably, Gap shares have historically risen following earnings in 68% of cases over the past five years, with a median one-day gain of 7.6%—a pattern of interest for event-driven investors.
Investors can approach this in two ways: either assess historical odds and position ahead of the earnings release, or analyze the correlation between short-term and medium-term post-earnings returns to guide positioning after the results. That said, if you seek upside with lower volatility than from individual stocks, the Trefis High Quality portfolio presents an alternative, having outperformed the S&P 500 and generated returns exceeding 91% since its inception. See earnings reaction history of all stocks.

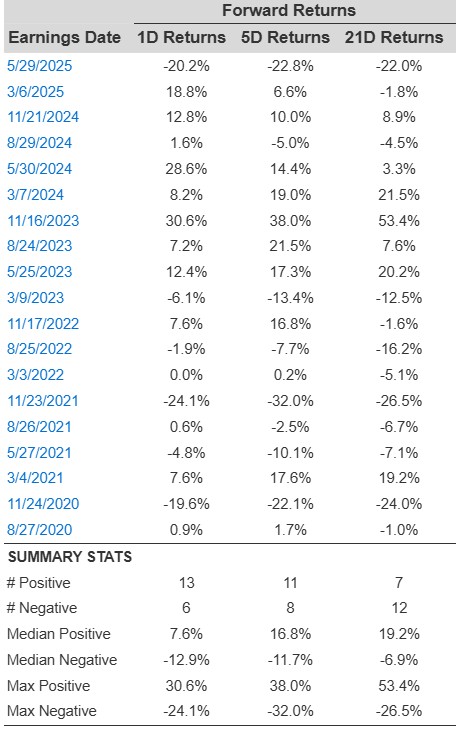
Gap’s Historical Odds Of Positive Post-Earnings Return
Some observations on one-day (1D) post-earnings returns:
- AEO’s One-Day Rally Offers a Chance to Reevaluate GAP
- Big Move for AEO, but Do GAP’s Margins and Growth Give It the Edge?
- The Real Engine Behind Netflix Stock Is Not Subscribers
- Has The AI Power Boom Pushed Bloom Energy Stock Too Far, Too Fast?
- How Much Upside Can LRCX Stock’s Growth Deliver?
- Why Did UnitedHealth Stock Choose Pain Over Growth?
- There are 19 earnings data points recorded over the last five years, with 13 positive and 6 negative one-day (1D) returns observed. In summary, positive 1D returns were seen about 68% of the time.
- Notably, this percentage increases to 75% if we consider data for the last 3 years instead of 5.
- Median of the 13 positive returns = 7.6%, and median of the 6 negative returns = -13%
Additional data for observed 5-Day (5D) and 21-Day (21D) returns post earnings are summarized along with the statistics in the table below.
GAP Correlation Between 1D, 5D, and 21D Forward Returns
Correlation Between 1D, 5D, and 21D Historical Returns
A relatively less risky strategy (though not useful if the correlation is low) is to understand the correlation between short-term and medium-term returns post earnings, find a pair that has the highest correlation, and execute the appropriate trade. For example, if 1D and 5D show the highest correlation, a trader can position themselves “long” for the next 5 days if 1D post-earnings return is positive. Here is some correlation data based on 5-year and 3-year (more recent) history. Note that the correlation 1D_5D refers to the correlation between 1D post-earnings returns and subsequent 5D returns.

GAP Correlation Between 1D, 5D and 21D Historical Returns
Learn more about Trefis RV strategy that has outperformed its all-cap stocks benchmark (a combination of all 3, the S&P 500, S&P mid-cap, and Russell 2000), to produce strong returns for investors.
Invest with Trefis Market-Beating Portfolios