How To Trade Ford Stock Ahead Of Q3 Earnings?
Ford Motor (NYSE:F) is set to report its Q3 2025 earnings on Thursday, October 23, 2025. Earnings are expected to come in at about $0.35 per share, per consensus estimates, down from $0.49 per share in the year-ago period, while revenues are likely to rise marginally to about $43.42 billion. Ford’s sales in the U.S. have been strong, with the automaker reporting 545,522 vehicles sold over Q3, up 8.2% year over year. Growth was driven by stronger demand for EVs as buyers sought to take advantage of federal tax credits that expired in September. Ford’s trucks have also been doing well, with the F-Series selling 207,732 units, up 4.7% year-over-year. However, sales in international markets are likely to be weaker over the quarter.

Image by Joern Florian Kahn from Pixabay
The company has $46 billion in current market capitalization. Revenue over the last twelve months was $185 billion, and it was operationally profitable, with $2.9 billion in operating profits and net income of $3.2 billion. While a lot will depend on how results stack up against consensus and expectations, understanding historical patterns might just turn the odds in your favor if you are an event-driven trader.
There are two ways to do that: understand the historical odds and position yourself prior to the earnings release, or look at the correlation between immediate and medium-term returns post earnings and position yourself accordingly after the earnings are released. That said, if you seek upside with lower volatility than individual stocks, the Trefis High Quality portfolio presents an alternative – having outperformed the S&P 500 and generated returns exceeding 105% since its inception.
See earnings reaction history of all stocks
Ford Motor’s Historical Odds Of Positive Post-Earnings Return
Some observations on one-day (1D) post-earnings returns:
- There are 20 earnings data points recorded over the last five years, with 10 positive and 10 negative one-day (1D) returns observed. In summary, positive 1D returns were seen about 50% of the time.
- However, this percentage decreases to 42% if we consider data for the last 3 years instead of 5.
- Median of the 10 positive returns = 2.6%, and median of the 10 negative returns = -8.0%
Additional data for observed 5-Day (5D) and 21-Day (21D) returns post earnings are summarized along with the statistics in the table below.
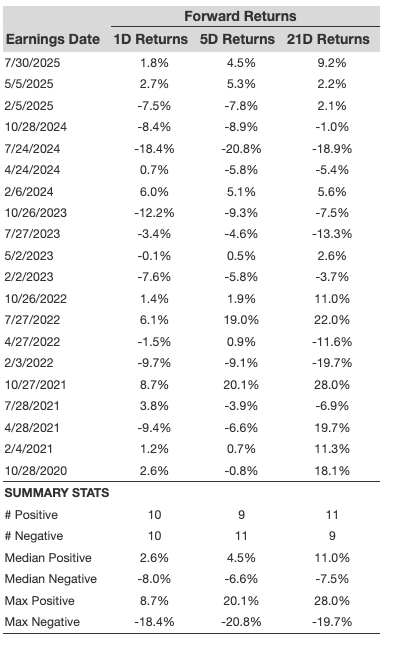
1D, 5D, and 21D Post Earnings Return
Correlation Between 1D, 5D, and 21D Historical Returns
A relatively less risky strategy (though not useful if the correlation is low) is to understand the correlation between short-term and medium-term returns post earnings, find a pair that has the highest correlation, and execute the appropriate trade. For example, if 1D and 5D show the highest correlation, a trader can position themselves “long” for the next 5 days if the 1D post-earnings return is positive. Here is some correlation data based on a 5-year and a 3-year (more recent) history. Note that the correlation 1D_5D refers to the correlation between 1D post-earnings returns and subsequent 5D returns.
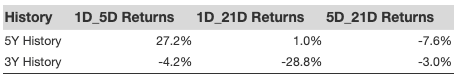
Correlation Between 1D, 5D and 21D Historical Returns
Learn more about Trefis RV strategy that has outperformed its all-cap stocks benchmark (combination of all 3, the S&P 500, S&P mid-cap, and Russell 2000), to produce strong returns for investors. Separately, if you want upside with a smoother ride than an individual stock like Ford Motor, consider the High Quality portfolio, which has outperformed the S&P and clocked >105% returns since inception.
Invest with Trefis Market-Beating Portfolios
See all Trefis Price Estimates