How Will Chevron Stock React To Its Upcoming Q1 Earnings?

Chevron Corporation (NYSE: CVX) is scheduled to release its fiscal first-quarter earnings on Friday, May 2, 2025, with analysts projecting earnings of $2.15 per share on $48.39 billion in revenue. This would represent a 28% year-over-year decline in earnings despite a 4% increase in sales compared to the prior year’s figures of $2.97 per share and $46.74 billion in revenue. Historically, Chevron’s stock has shown a tendency to underperform following earnings announcements, having declined 53% of the time with a median one-day drop of 3.5% and a maximum observed decline of 7%.
While the company has signaled that demand may soften due to U.S. tariffs and OPEC’s accelerated production, it remains committed to its current capital spending strategy. Chevron maintains a strong financial foundation, with a market capitalization of $238 billion, trailing twelve-month revenue of $193 billion, and net income of $18 billion. Though short-term performance will largely depend on how actual results compare to consensus estimates, historical trading patterns suggest potential downside volatility, which may be relevant for event-driven investors evaluating near-term positioning.
For event-driven traders, historical patterns may offer an edge, whether by positioning ahead of earnings or reacting to post-release moves. That said, if you seek upside with lower volatility than individual stocks, the Trefis High Quality portfolio presents an alternative, having outperformed the S&P 500 and generated returns exceeding 91% since its inception. See earnings reaction history of all stocks.
 Image by AdmiralFox from Pixabay
Chevron’s Historical Odds Of Positive Post-Earnings Return
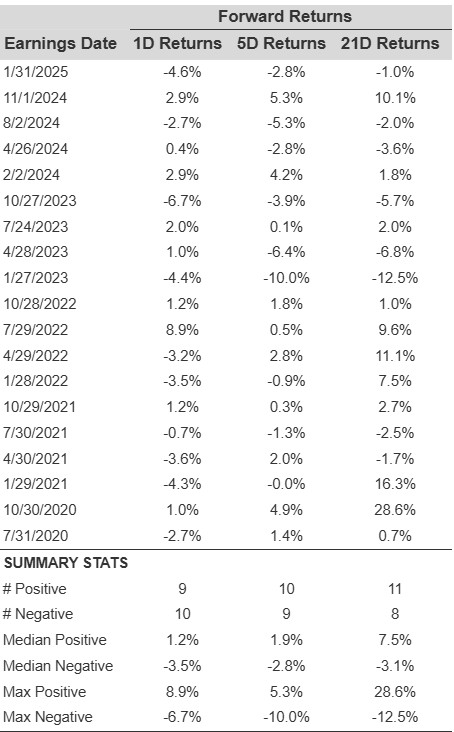
Some observations on one-day (1D) post-earnings returns:
- There are 19 earnings data points recorded over the last five years, with 9 positive and 10 negative one-day (1D) returns observed. In summary, positive 1D returns were seen about 47% of the time.
- Notably, this percentage increases to 64% if we consider data for the last 3 years instead of 5.
- Median of the 9 positive returns = 1.2%, and median of the 10 negative returns = -3.5%
Additional data for observed 5-Day (5D), and 21-Day (21D) returns post earnings are summarized along with the statistics in the table below.
Correlation Between 1D, 5D, and 21D Historical Returns
A relatively less risky strategy (though not useful if the correlation is low) is to understand the correlation between short-term and medium-term returns post earnings, find a pair that has the highest correlation, and execute the appropriate trade. For example, if 1D and 5D show the highest correlation, a trader can position themselves “long” for the next 5 days if 1D post-earnings return is positive. Here is some correlation data based on 5-year and 3-year (more recent) history. Note that the correlation 1D_5D refers to the correlation between 1D post-earnings returns and subsequent 5D returns.
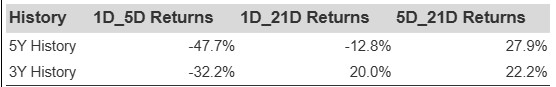
CVX Correlation Between 1D, 5D and 21D Historical Returns
Learn more about Trefis RV strategy that has outperformed its all-cap stocks benchmark (combination of all 3, the S&P 500, S&P mid-cap, and Russell 2000), to produce strong returns for investors.
Invest with Trefis Market-Beating Portfolios